DR is one of the most common microvascular complications of diabetes and is the leading cause of blindness and visual impairment worldwide [1]. DR can be classified into mild, moderate and severe Non-Proliferative Diabetic Retinopathy (NPDR) and Proliferative Diabetic Retinopathy (PDR). NPDR is the early stage of DR, can be characterized by formation of microaneurysms, retinal vascular permeability and leakage while PDR is late onset characterized by neovascular proliferation and vitreous haemorrhage which causes severe visual impairment in diabetic patients.
Probability of retinal complications increases with increasing duration of diabetes and it is postulated that DR will become one of the most important cause of blindness that is over 10,000 people with diabetes per year. Further it is documented that more than 77% of patients who survive for over 20 years with T2D are affected by retinopathy [2]. Globally, it is estimated that the number of DR patients will increase from 126.6 million in 2010 to 191.0 million by 2030 and correspondingly the patients with Vision-Threatening Diabetic Retinopathy (VTDR) will increase from 37.3 million to 56.3 million, if proper measures are not taken on time [3]. Epidemiological studies relate the prevalence of DR to several factors like adaptation of a sedentary lifestyle, difference in food habits, distinct environment and diverse genetic susceptibility [4,5].
Dyslipidemia is the major biochemical alteration in diabetes mellitus. Multitudes of studies have evidenced increased levels of Triglycerides (TG), cholesterol, Low Density Lipoprotein (LDL) and decreased level of High Density Lipoprotein (HDL) in diabetic patients but certain studies alone have shown traditional serum lipids were positively associated with the risk of DR and is supported by data from the Diabetes Control and Complications Trial [6,7], whereas other studies have not consistently shown similar associations between the serum lipids and the progression of DR in T2D [8-11].
Recently apolipoproteins have been found as the better predictors of DR. Apolipoprotein A1 (Apo-A1), a constituent of antiatherogenic HDL act as a lipid transporter and has protective mechanism within retina and apolipoprotein B (Apo- B), a constituent of atherogenic LDL, is reported to be present in the retina of the patients with DR. These are found more directly relevant to the biophysiological changes associated with DR than the traditional lipids [12].
Considering the increasing prevalence of DR, it is mandatory to prevent and manage this diabetes complication through identifying better diagnostic markers and ophthalmic examination. In this study, patients were screened for DR by fundus photography, as it is more sensitive and specific method. Based on the findings of fundus photographs, two different groups of T2D patients with retinopathy and without retinopathy were used for this study. Further apolipoproteins are considered as better diagnostic markers for DR than traditional lipids. But at what extent these apolipoprotein measures would be useful to identify an individual at risk of development of type 2 DR remains uncertain. Hence, the present study was undertaken to compare and find out the association of DR to either the serum levels of Apo-A1, Apo B, Apo B/Apo-A1 ratio or with traditional lipid profile in T2D patients.
Materials and Methods
The present study was a case-control study conducted with 150 subjects who attended outpatient and in-patient department of Ophthalmology in collaboration with Dept. of Biochemistry, Sri Lakshmi Narayana Institute of Medical Sciences, Puducherry from June 2016- December 2016. The sample size for this study was determined based on the prior study and they reported the prevalence of DR was 66.8% [13]. Informed consent was obtained from the patients and the study was approved by institutional ethical committee. The diagnosed T2D patients were included in this study. The patients in the age group of 35 to 80 years were selected and the clinical information including sex and duration of diabetes were obtained from the medical records and patients personal interview.
Patients with Type 1 diabetes, secondary diabetes, gestational diabetes, severe hypertension, acute infections, known cardiovascular and renal diseases, liver dysfunction, severe anemia, thyroid disorders, history of glaucoma, previous vitreo-retinal surgery, and/or had a dense cataract were excluded.
Study Design
The study was carried out with 100 T2D patients and was divided into 2 groups and they were compared with 50 subjects of age and sex matched healthy controls.
Group I-Con: 50 subjects of age and sex matched healthy controls
Group II-Non-DR: 44 subjects with T2D for more than 5 years without signs of DR
Group III: DR-56 subjects with T2D for more than 5 years with signs of DR.
Evaluation of DR
Participants had a standardized clinical examination and dilated fundus examination. With dialated fundus the diagnosis and grading of DR were done by slit lamp (with a Volk 90 D lens) biomicroscopy and colored fundus photographs using a Topcon TRC-50DX fundus camera (Topcon Medical systems, Inc. NJ, USA) according to Early Treatment of Diabetic Retinopathy Study (ETDRS) criteria.
Based on the findings of fundus photographs, patients were divided into diabetes without signs of DR and those with signs of DR. Patients with retinopathy (Group III) was classified into NPDR and PDR. NPDR was further sub-classified into mild (mild microaneurysm or intra-retinal haemorrhage), moderate (moderate microaneurysm or intra-retinal haemorrhage, early Intra-Retinal Microvascular Abnormality (IRMA), hard/soft exudates may or may not be present), and severe (all four quadrants of severe microaneurysm or intra-retinal haemorrhage, only two quadrants of venous beading and only one quadrant of IRMA).
Sample Preparation
Blood samples were collected from all individuals. About 5ml of blood was withdrawn from overnight fasted individuals in EDTA coated wells to assay Fasting Blood Sugar (FBS), Post-Prandial Blood Sugar (PPBS) and HbA1C. Further serum was separated to measure lipid profile and apolipoprotein levels.
Biochemical Assays
FBS and PPBS were estimated by GOD-POD method and HbA1C by turbidimetric method. Serum lipids were estimated in fasting blood sample. Serum TG and Total Cholesterol (TC) were measured by enzymatic methods, Glycerol 3 phosphate oxidase N-ethyl sulfpropyl N anisidine and cholesterol oxidase-peroxidase end point methods respectively. Serum HDL was estimated by enzyme selective protection method. Serum LDL was calculated using Friedwald’s formula (LDL=TC-HDL-TG/5). Serum Apo-A, Apo B were estimated using fully automated nephelometry (BN- II-Nephelometer; Siemens Healthcare Diagnostics, Eschborn, Germany).
Statistical Analysis
Data analysis was performed using SPSS statistical software (version 22, SPSS, Inc., Chicago, Illinois, USA). The results were presented as mean±SD. Significant differences between groups were examined by one-way analysis of variance (ANOVA) followed by Duncan’s test. A value of P < 0.05 was considered statistically significant.
Results
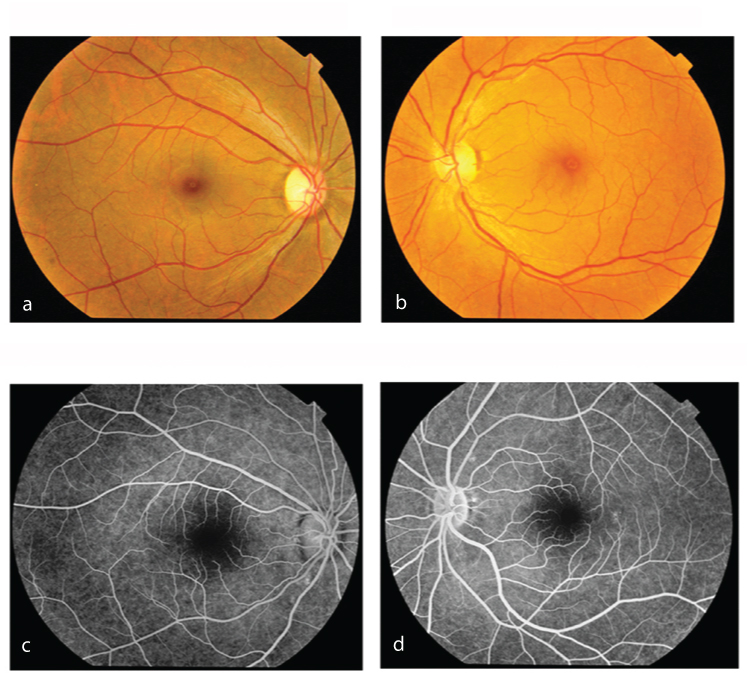
Grades of DR in T2D patients are given in [Table/Fig-1]. Of 56 DR patients, 14 (25%) had mild NPDR, 24 (43%) had moderate NPDR, 11 (20%) had severe NPDR and 7 (12.5%) had PDR. Frequency of DR was found to be high in 27 (48.2%) patients in the age group of 61-70 years and low in 2 (3.5%) patients in the age group of 35-50 years. [Table/Fig-2] data showed that there was an increase in incidence of DR as increase in duration of disease. Increased level of FBS was observed in Groups II and III as compared to Group I and when comparing Group III patients have higher FBS than Group II. Patients with Group III (severe NPDR and PDR) had higher HbA1C as compared to Group I and Group II suggesting poor glycaemic control (increased HbA1c) in the prevalence of DR. Retinopathy was evident in the fundus photographs of DR patients (Group III) when compared to Group I and Group II. Representative fundus photographs and fluorescein angiogram pictures from each group were given as [Table/Fig-3a-d,e-f,g-h,i-j,k-l].
Grades of DR according to age group in T2D patients.
| Age in Years | DR (n=56) | Total |
|---|
| Mild NPDR(n=14)25% | Moderate NPDR(n=24)43% | Severe NPDR(n=11) 20% | PDR(n=7)12% |
|---|
| 35-50 | 2 | - | - | - | 2 |
| 51-60 | 4 | 12 | - | - | 16 |
| 61-70 | 7 | 10 | 7 | 3 | 27 |
| 71-80 | 1 | 2 | 4 | 4 | 11 |
| Total | 14 | 24 | 11 | 7 | 56 |
Association of duration of diabetes, fasting blood sugar and HbA1c in T2D patients with and without retinopathy.
| Parameters | Group ICON | Group IINon-DR | Group III DR | p-value |
|---|
| MildNPDR | Moderate NPDR | SevereNPDR | PDR |
|---|
| Duration of diabetes (years) | - | 8.6±0.63 | 7.8±0.7 | 11.4±1.2 | 13.6±1.8 | 15.4±2.4 | <0.001** |
| FBS (mg/dl) | 96±15.1 | 148±23 | 120±18 | 128±27 | 156±30 | 173±34 | <0.04* |
| HbA1C (%) | 5.6±0.34 | 7.9±0.5 | 7.8±0.5 | 8.1±0.6 | 11.1±1.2 | 13.8±1.4 | <0.001** |
*p<0.05 statistically significant
**p<0.001 statistically highly significant
p values are calculated using one way anova
Representative Picture of control (Group I): a,b): Fundus photos of right and left eyes of 58-year-old male patient; c,d) Fluorescein angiogram depicting eyes of the same patient.
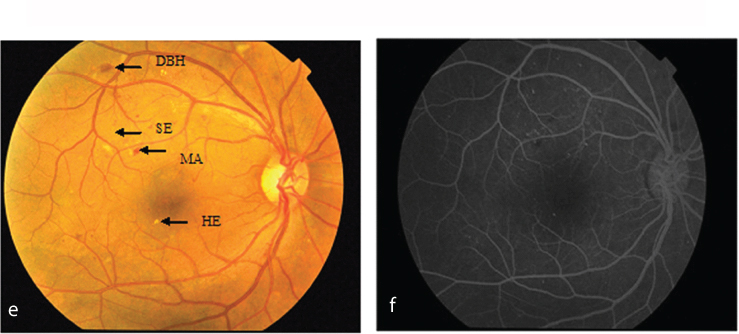
Representative Picture of mild NPDR (Group III): e) Fundus photo of 48-year-old male patient (left eye) showing DBH (Dot and blot haemorrhage), SE (soft exudate), MA (microaneurysm) and HE (hard exudates); f) Fluorescein angiogram depicting changes in the eye of the same patient.
Representative picture of moderate NPDR: g) Fundus photo of 57-year-old female patient (right eye) showing DBH (Dot and blot haemorrhage), SE (soft exudate), MA (microaneurysm) and HE (hard exudates); h) Fluorescein angiogram depicting changes in the eye of the same patient.

Representative picture of severe NPDR: i) Fundus photo of 65-year-old female patient (left eye) showing SE, HE, CSME (clinically significant macular oedema), VB (Venous beading) and IRMA (Intraretinal microvascular abnormality); j) Fluorescein angiogram depicting changes in the eye of the same patient.

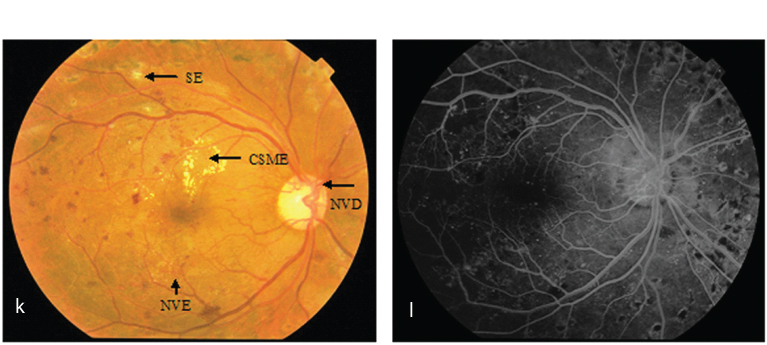
Representative picture of PDR: k) Fundus photo of 72-year-old male patient (left eye) showing SE, CSME, NVD (neovascularization of the disc), NVE (neovascularization elsewhere); l) Fluorescein angiogram depicting changes in the eye of the same patient.
[Table/Fig-4] represents traditional lipid profile and apolipoproteins in T2D patients with and without DR. A raised level of TG was observed in Group II and Group III particularly in severe NPDR and PDR as compared to Group I. When comparing Groups II and III, TG levels were highly elevated in severe NPDR and PDR of DR group than non-DR group (P<0.001). HDL-C was inversely associated with the severity of DR (p<0.05). There was no significant association of LDL-C and total cholesterol with Group III as compared to Groups I and II. This data indicates that TG is associated with the increased incidence and severity of DR in T2D subjects and not LDL or total cholesterol.
Association of apolipoproteins and serum lipids in T2D patients with and without retinopathy.
| Parameters | Group ICON | Group IINon-DR | Group III DR | p-value |
|---|
| MildNPDR | Moderate | Severe | PDR |
|---|
| Triglycerides(mg/dl) | 134±16 | 165±37.2 | 121±13.3 | 132±14 | 169±42 | 202±70 | <0.001** |
| Total cholesterol (mg/dl) | 158±25.3 | 202±34.3 | 188±27.1 | 204±33 | 209±31 | 213±36.3 | 0.38 |
| HDL cholesterol (mg/dl) | 58±12 | 51±11 | 52±13 | 50±11.3 | 48±10.8 | 46±8.2 | <0.05* |
| LDL cholesterol(mg/dl) | 109±18.4 | 128±26.8 | 115±19 | 117±19.6 | 120±20 | 129±28 | 0.42 |
| Apo- A1(mg/dl) | 285±13.4 | 230±43 | 212±25 | 193±19 | 136±17 | 118±14 | <0.001** |
| Apo B(mg/dl) | 102±9.8 | 120±19.2 | 125±20 | 149±32.4 | 174±43.4 | 197±48.8 | <0.001** |
| Apo B/Apo-A1ratio | 0.72±0.05 | 0.94±0.1 | 0.78±0.08 | 0.8±0.07 | 1.27±0.2 | 1.78±0.45 | <0.001** |
*p<0.05 statistically significant
**p<0.001 statistically highly significant
Decreased level of serum ApoA1 was found in Group II and Group III as compared to Group I. When comparing Groups II and III, Group III patients have decreased levels of serum ApoA1. Further both serum ApoB and the ApoB-to-ApoA1 ratio were higher in patients with DR than non-DR group pointing out strong and close association of apolipoproteins with the progression and severity of DR (P < 0.001).
Discussion
Disorder in carbohydrate metabolism leads to diabetes and its epidemic proportion reaching high in both developing and developed countries. This has led to one of the complications of diabetes, like DR which is highly prevalent in the general population.
Studies reported that DR may develop at any age like diabetes and those who acquire the disease at younger age are more likely to develop retinopathy [14]. Further studies found duration of diabetes is one of the risk factors for the development of DR [15,16]. In the present study duration of diabetes has been found to be one of important determinant for the severity of DR and is consistent with the aforementioned available literature.
Impaired glucose homeostasis is an important predictor for T2D which can be recognized in the present study through increased levels of FBS. Good metabolic control is essential for successful ophthalmic care of patients with diabetes. Many studies reported the close association of higher HbA1c and development and progression of DR [17-19]. In consistent with this, the present study found a higher HbA1c in groups II and III compared to control group indicates that poor glycaemic control could influence not only the development but also the progression of DR.
Dyslipidemia can be characterized mainly by elevated levels of TG which is considered to be an important risk factor for the development of DR in diabetic subjects. Earlier serum lipids have been proposed to be risk factors for DR [20-22], although the connection of lipids to DR has been relatively understudied with diabetes duration, HbA1c and blood pressure. Our study demonstrated that of the traditional lipid measures, only higher TG and lower HDL cholesterol were associated with DR. Our findings support previous data that traditional serum lipids are not stronger or inconsistent for the association with DR [8-11].
Very little literature is available to show apolipoproteins are the better diagnostic markers of DR although the exact underlying mechanism is indecisive but we have strong evidence for the possibility of our findings. Studies reported that ApoA1, the main HDL structural protein and higher ApoA1 levels suggest protective mechanisms within the retina via ApoA1 against lipid deposition and inflammation-induced lipotoxicity leading to DR [23,24]. Further ApoA1 has anti-inflammatory and anti-oxidant effects [25] and is also key to intraretinal lipid transport [26]. Therefore, it is conceivable that a low level of this protective agent may be causative to promote DR. The present study showed lower levels of serum ApoA1 in DR patients. Wu et al., reported increased levels of ApoB association with greater severity of DR and suggested that higher ApoB levels may lead to higher lipoprotein-related toxins production which could damage the retinal vascular cells [27]. Furthermore it is reported that decreased clearance of LDL and TG is due to over production of ApoB and low lipoprotein lipase activity and its implication in endothelial cell dysfunction and local inflammatory response releasing cytokines and growth factors for neovascularisation in retina [28]. Literature search reported that that ApoA1 was not positively connected to DR further ApoB and ApoB-to-ApoA1 ratio were positively correlated with DR [9,29,30]. Similar kind of results were reported very recently by Prakash et al., and Ankit et al., [10,11]. Our results are strongly consistent with those of aforementioned literature.
Limitation
There were some limitations in our study. The sample size was small and it’s challenging outcome need to be assessed in large population as a prospective study in order to prove the stronger association between apolipoproteins and DR.
Conclusion
Our study demonstrates that there is close association between serum apolipoproteins (ApoA1, ApoB, and the ApoB-to-Apo-A1 ratio) and the progression and severity of DR in patients with T2D. Concomitantly, in our study conventional serum lipid levels except TG and HDL cholesterol were not significantly associated with DR. Very recently the relationship between serum ApoA1 and B with DR is proven and this may be a strong support for our study. Although apolipoprotein measurements are considered as emerging biomarkers to assess DR, it has not been routinely investigated by the clinicians, considering its protective mechanism further studies are needed to unravel the underlying mechanisms in order to decrease the prevalence and to offer comprehensive eye care to prevent blindness. Clinicians in other regions are encouraged to perform similar studies to learn if such relationships exist. Pending confirmatory results in larger studies will help ophthalmologists for the early diagnosis of DR with better biomarker. Hence, our findings based on small sample size support these apolipoprotein measures might have ability to act early and as better biomarkers of DR than traditional lipid measures.
*p<0.05 statistically significant
**p<0.001 statistically highly significant
p values are calculated using one way anova
*p<0.05 statistically significant
**p<0.001 statistically highly significant