Rat in vivo experiments done in the departmental laboratory with whole aqueous extract of C. collinus resulted in type 1 Distal Renal Tubular Acidosis (DRTA) and death of the animals due to type II respiratory failure [20]. While inhibition of the vacuolar H+-ATPase in the renal epithelium was proposed as the cause for the DRTA [21], the cause for type II respiratory failure was yet not clear. Literature search revealed a hypothesis that stated the role of the proton channels on the apical membrane of alveolar epithelial cells in the elimination of carbon dioxide from the lungs [22]. Hence, it was decided to explore if this hypothesis could hold good for the type II respiratory failure observed in the rat in vivo experiments with aqueous extract of C. collinus. To test the above said hypothesis, we decided to assess the effects of the active principles of C. collinus on proton channels.
Materials and Methods
This was an experimental study which was conducted between January 2011 and December 2011 in the Department of Physiology, Christian Medical College, Vellore, Tamil Nadu, India. The study was reviewed and approved by the Institute Review Board and Ethical Committee.
Isolation of Cleistanthin A
Cleistanthus collinus leaves were collected from Palamathi hills and Amriti forests in Vellore. These leaves were shade dried and delipidated using n-Hexane. The dry defatted leaves were soaked in distilled water for 12 hours after which the supernatant was separated by filtration. The wet residual leaves were then soaked in 95% acidified ethanol (acidified with dilute acetic acid) for 48 hours following which the supernatant was collected after filtering through a gauze piece. This supernatant was again fractionated using chloroform and the bottom layer (chloroform) was collected in a separate flask, poured into petridishes and concentrated with ethanol. After drying in hot air oven at 37°C, the powder was scraped off using a scalpel blade and used for patch clamp studies. The fraction was identified as Cleistanthin A by its characteristic fluorescence on TLC [Table/Fig-1].
Thin layer chromatographic profile of various fractions obtained during the process of isolation of Cleistanthin A.

Validation of the isolated sample of Cleistanthin A
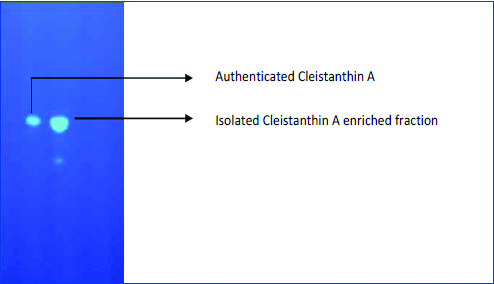
In order to validate the isolated sample of Cleistanthin A, TLC was done to compare the TLC profiles of the isolated fraction and an authenticated sample of Cleistanthin A obtained from Godavari biorefineries, Mumbai. A 1 mg each of both the samples were dissolved in 20 μL of a mixture of chloroform and ethanol (50:50) to perform the TLC. It was observed that the TLC profile of the isolated sample of Cleistanthin A matched perfectly with that of the authenticated sample [Table/Fig-2].
Thin layer chromatography profile comparing the isolated Cleistanthin A enriched fraction and the authenticated sample of Cleistanthin A. Both the fractions had similar TLC profile with respect to their characteristics fluorescence.
Isolation of Human Neutrophils
Healthy individuals working in the institutional campus were recruited in the study after getting their consent in written form. A self-reported health status of these individuals was noted and individuals with known history of any medical illnesses were excluded from the study. A 5 mL of venous blood was collected from each individual and it was immediately mixed with 1 mL of Acid Citrate Dextrose (ACD) and 3 mL of Dextran and left aside for one hour for sedimentation. At the end of one hour, the supernatant including the buffy coat (which contains the white blood cells) was collected and centrifuged at 1000 rpm for 12 minutes. The supernatant was discarded and 3 mL of distilled water was added to the remaining pellet and mixed gently for hypotonic lysis of red blood corpuscles. Within 25 seconds, 1 mL of 0.6 M potassium chloride was added to restore the tonicity of the solution. The volume in the centrifuge tube was made up to 12.5 mL with single strength Phosphate Buffered Saline (PBS) and again centrifuged at 1000 rpm for six minutes at 4°C.
At the end of six minutes, the supernatant was removed and the steps involving hypotonic lysis of RBC’s and restoration of tonicity were performed until the RBC’s were completely removed. Finally, the pellet containing WBCs was suspended in 0.7 mL of PBS.
The cells suspended in PBS were layered over 0.8 mL of Ficoll-Paque (Sigma-Aldrich, St. Louis, MO, USA) and centrifuged at 1000 rpm for 30 minutes at 4°C. Ficoll acted as a density gradient and separated the mononuclear cells from the rest of the WBC’s. At the end of 30 minutes, the mononuclear cell layer was removed and 0.6 mL of PBS was added to the pellet containing neutrophils and mixed gently. This neutrophil suspension was stored in refrigerator until taken for patching. Six cells were studied in each of the control and test groups.
Electrophysiology
The micropipettes (Borosilicate Kimax-51 melting point capillary glass tubes, Fischer Scientific, USA) used for patch clamp recording were fabricated in two stages using the Narishige Model PP-830 pipette puller and the tips of the pipette were polished using the GlasswoRX F-500 fine point microforge filament. The pipettes obtained at the end had a resistance of 3-5 mega ohms when immersed in the bath solution. A 100 μL of the isolated neutrophil suspension was added to a petridish containing 1900 μL of external (bath) solution. The composition of the bath solution was (in mM) HEPES 100, CaCl2 3, EGTA 1, Glucose 10 and Cesium chloride 60, pH 7.5. The pipettes were filled with the internal solution which contained (in mM) MES 100, Magnesium chloride 2, EGTA 1, Glucose 10, Cesium chloride 35 and pH 6.
Proton currents were recorded in the whole-cell mode. Acquisition of data was done using Axopatch 200B patch-clamp amplifier, and digitised with Axon Instruments Digidata 1322A analogue-digital converter. A10 kHz low pass Bessel filter was used for online filtering of data, and the recordings were sampled at 25 kHz. The pClamp 9 software was used for acquisition and analysis of the data. Igor pro Version 5.0.4.8 (Wavemetrics) was also used for offline analysis.
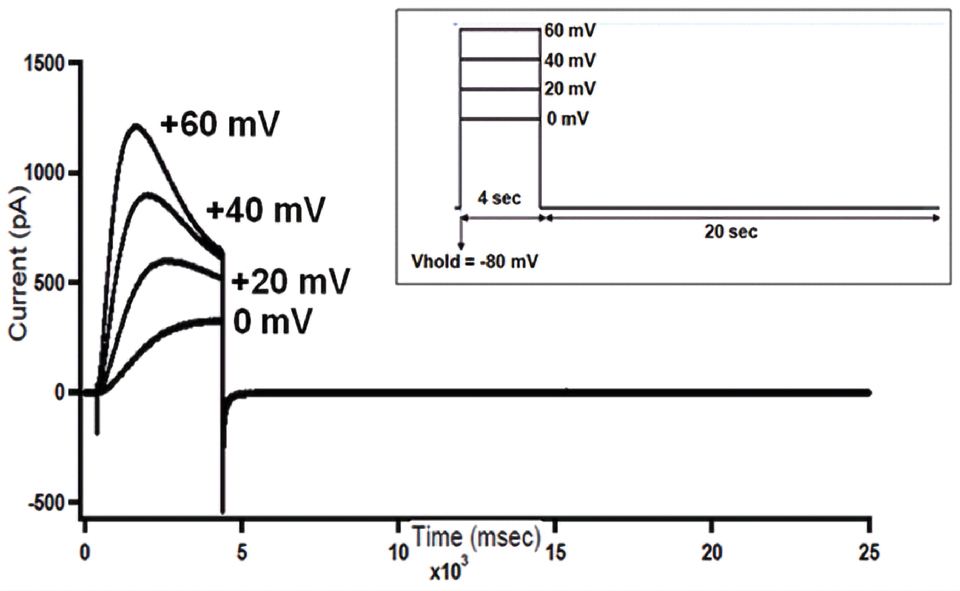
On obtaining a giga-ohm seal, cell capacitance was cancelled, and series resistance compensation (60-70%) was applied before each recording. Each cell was clamped at a holding voltage of -80 mV (V hold), and stepped to voltages ranging from 0 to +60 mV at +20 mV increments. Each test pulse lasted for four seconds, which allowed complete activation of proton currents. After each test pulse, the membrane was brought back to the holding potential and held for 20 seconds before the commencement of the next pulse [Table/Fig-3a]. Current density (current in picoamperes/membrane capacitance of neutrophils in picofarads) was calculated to compare the differences in proton currents before and after interventions with the test or control solution. To obtain the percentage current remaining, the magnitude of current density at different voltages after the intervention with the control or test solution was expressed as a percentage of current density before the intervention.

Raw tracings of voltage gated proton currents recorded from a human neutrophil. The protocol used was, Vhold = -80mV, test pulses from 0 to +60 mV at +20 mV increments. Inset: Voltage clamp protocol used for recording proton currents.
Statistical Analysis
Statistical analysis was done using SPSS 16.0 (SPSS Software Inc., Chicago, IL, USA). Comparison of current densities within the groups (control and test) before and after intervention (control solution or test solution) was done using Wilcoxon signed-rank test. Similarly, comparison of the percentage current remaining across the groups (control and test), was done using Mann-Whitney U test. A p-value <0.05 was considered significant.
Results
Normal proton currents were recorded in the neutrophils using the voltage clamp protocol. The proton currents showed voltage dependent and slow activation kinetics, wherein the magnitude of the current increased with increasing depolarising voltages [Table/Fig-3a,b]. Following this, the cells were exposed to the control or test solution which was added to the bath. Significant differences were noted between the pre and post-intervention current densities for all the voltages with the control solution [Table/Fig-4], while there were no such significant differences with the test solution [Table/Fig-5].
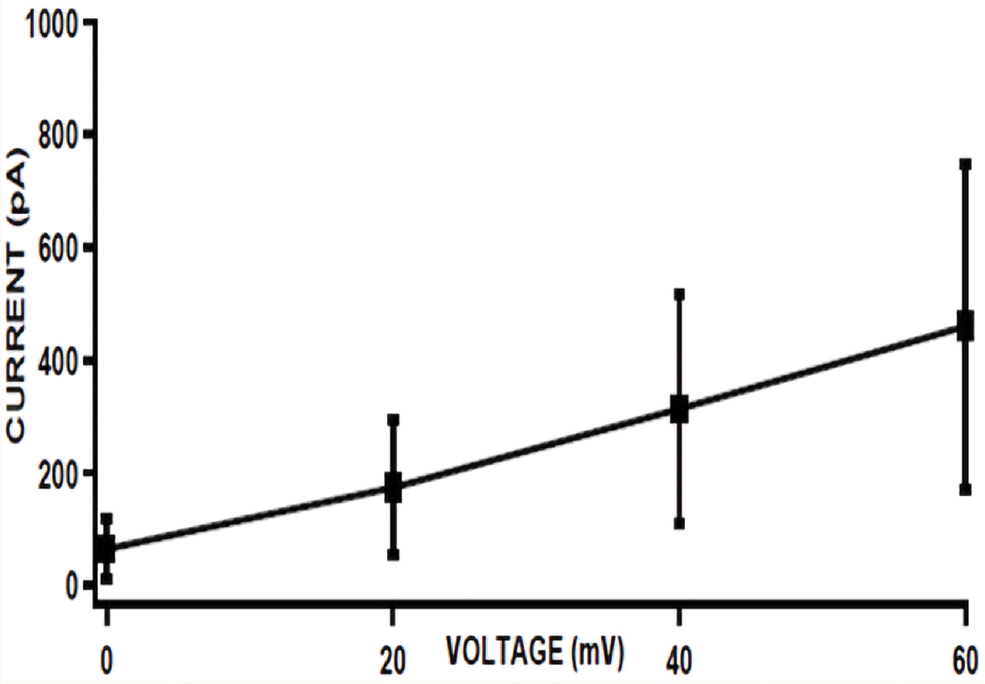
Representative I-V Plot of voltage-gated proton currents from a human neutrophil (Mean±SD, N=12). The amplitude of current in picoamperes in Y-axis is plotted against different voltages on the X-axis.
Comparison of current densities (pA/pF–picoamperes/picofarads) at different voltages before (pre-intervention) and after (post-intervention) the intervention with control solution.
| Voltage (mV) | Pre-intervention current density (pA/pF) (n=6) mean±SD | Post-intervention current density (pA/pF) (n=6) mean±SD | p-value |
|---|
| 0 mV | 30.46±23.21 | 24.82±24.77 | 0.028* |
| 20 mV | 77.30±43.87 | 63.70±47.62 | 0.028* |
| 40 mV | 134.04±70.12 | 108.31±65.41 | 0.028* |
| 60 mV | 195.20±102.13 | 160.93±90.24 | 0.046* |
Values are expressed as mean±Standard Deviation. Wilcoxon signed-rank test p-value
*p<0.05
Effect of Control Solution on Voltage Gated Proton Currents
The isolated fraction of Cleistanthin A was found to dissolve well in a mixture of chloroform and ethanol. Hence, 10 μL of chloroform and 10 μL of ethanol was mixed and used as the control solution for all the experiments. After the recording of normal proton currents (pre-intervention currents), 20 μL of the control solution was added to the bath and the same voltage clamp protocol was repeated to record the post-intervention current amplitudes. It was observed that the post-intervention current densities were significantly lesser (p<0.05) than the pre-intervention current densities at all the voltages [Table/Fig-4].
Effect of Cleistanthin A on Proton Currents
The test solution was prepared by dissolving 0.5 mg of Cleistanthin A enriched fraction in 10 μL of chloroform and 10 μL of ethanol. Recording of pre-intervention and post-intervention currents were done in the same way as that for the control solution. There was no significant difference between the pre-intervention and post-intervention current densities with Cleistanthin A [Table/Fig-5].
Comparison of current densities (pA/pF–picoamperes/picofarads) at different voltages before (pre-intervention) and after (post-intervention) the intervention with Cleistanthin A.
| Voltage (mV) | Pre-intervention current density (pA/pF) (n=6) mean±SD | Post-intervention current density (pA/pF) (n=6) mean±SD | p-value |
|---|
| 0 mV | 14.08±19.58 | 16.98±24.34 | 0.345 |
| 20 mV | 41.42±49.48 | 47.59±58.13 | 0.345 |
| 40 mV | 80.74±87.73 | 85.45±92.73 | 0.753 |
| 60 mV | 121.59±122.81 | 124.53±125.07 | 0.600 |
Values are expressed as mean±Standard Deviation. Wilcoxon signed-rank test p-value
Comparison of Percentage (%) Current Remaining in the Control and Test Groups
Comparison of the average percentage current remaining across the control and test groups did not reveal any significant difference between the two groups [Table/Fig-6].
Comparison of percentage of proton currents remaining after the addition of control (chloroform and ethanol) or test (Cleistanthin A enriched fraction) solution.
| Voltage (mV) | Percentage of proton currents remaining after the addition of control solution (n=6) mean±SD | Percentage of proton currents remaining after the addition of Cleistanthin A (n=6) mean±SD | p-value |
|---|
| 0 mV | 70.14±31.79 | 94.69±44.90 | 0.522 |
| 20 mV | 76.97±22.03 | 98.72±33.18 | 0.522 |
| 40 mV | 79.64±13.45 | 95.84±30.03 | 0.522 |
| 60 mV | 83.38±13.40 | 95.70±25.56 | 0.631 |
Values are expressed as mean±SD, Mann-Whitney U test p-value
Discussion
The study was done to see the effect of Cleistanthin A on the voltage gated proton channels of human neutrophils. To the best of our knowledge, this is the first study of its kind to have reported the effect of Cleistanthin A on voltage-gated proton channels using the patch clamp technique.
Cleistanthin A was isolated using liquid-liquid chromatography and human neutrophils were isolated by density gradient centrifugation technique. Proton currents were recorded in neutrophils by voltage clamp method and these currents had a similar profile to that described in literature [23]. The currents showed a slow activation kinetics and increase in magnitude with increasing depolarising voltages. However, in those cells where the current amplitude was very high a “droop” was seen in more positive voltages as reported in previous studies [23]. The reason for this phenomenon can be attributed to the depletion of protons which occurs due to repeated and high depolarising pulses. A study by DeCoursey TE et al., on rat alveolar epithelial cells reported that increasing the internal buffer concentration increased the current magnitude and reduced the depletion of proton currents with depolarising voltages [24]. In the present study, despite the high internal buffer concentration (100 mM MES) depletion of proton currents was still evident. Most probably, the high magnitude of currents would have caused a greater degree of proton depletion from the cytosol resulting in an increase in the intracellular pH in spite of high internal buffer concentration. The other possible causes may include: (i) low concentration of protons (ii) slow diffusion of the internal buffer when compared to the small monovalent ions leading to increased intracellular pH (iii) whole cell configuration. Moreover, the measured reversal potential for the proton currents was -67 mV which was less negative when compared to the calculated Nernst’s potential for protons (-90 mV). This shift in reversal potential can also be attributed to the depletion of proton currents during depolarising pulses. Thus, the established fact that the proton currents are prone for depletion effects is once again evident in this study [23].
While in the control group there was significant difference between the pre and post-intervention current densities which probably reflects time-dependent run down of proton currents, there was no significant difference between the pre and post-intervention proton current densities in the test group. It is therefore possible that Cleistanthin A stabilises the proton currents and prevents run down. However, when the post-intervention current density was normalised to the pre-intervention value and compared between the control and test group, there was no significant difference between the two groups. Hence, the inference would be that Cleistanthin A does not have any influence on the voltage-gated proton channels.
Limitation
The small sample size could be a major limitation to the study. Further studies are recommended to assess the dose dependent effects of Cleistanthin A and other active principles of C. collinus on the voltage-gated proton channels.
Conclusion
In this study, Cleistanthin A does not affect the voltage-gated proton channels of human neutrophils. Hence, the hypothesis that the type II respiratory failure observed in the rat in vivo experiments could be due to the inhibition of voltage gated proton channnels by Cleistanthin A was not supported. Future studies with a larger sample size are required to substantiate the results of the study.
Values are expressed as mean±Standard Deviation. Wilcoxon signed-rank test p-value
*p<0.05