Capnography is widely used in anaesthesia and critical care medicine, typically for monitoring patients with an endotracheal tube or Laryngeal Mask Airway (LMA) [1-5]. Capnography has also been used for non-intubated patients to detect apnoea or respiratory insufficiency [6,7].
Materials and Methods
This prospective study was approved by the Children’s Hospital Los Angeles Institutional Review Board (IRB; CHLA-15-00035). Independent observers for the study (a research nurse and a research respiratory therapist) were trained in capnography by a senior staff anaesthesiologist and company technical consultant. This study was conducted from March 2015 to January 2017 and adheres to STROBE guidelines.
Selection of Participants
All the participants were recruited from outpatient surgery centre at Children’s Hospital Los Angeles. Inclusion criteria were ASA physical status classification 1-3 patients with a body weight of 7 to 40 kg undergoing minor procedures with pre-existing or intraoperative placed central venous access. Exclusion criteria included abnormal facial anatomy which may be unfit to the cap-ONE® mask, the presence of major cardiac anomalies causing intracardiac shunt, cardiopulmonary/neurological instability anticipated to cause acute changes in respiratory status, baseline SpO2 <88%, and/or, baseline respiratory rate less than 15 or more than 60 breaths per minute. Demographic information was collected for eligible participants. Written, informed consent was obtained on the day of procedure.
Children less than 20 kg body weight wore infant cap-ONE® mask (small mask), whereas children more than 20 kg wore paediatric cap-ONE® mask (medium mask) according to the manufacturer’s instructions.
Data Sampling
The recording of capnography waveforms was started at PACU entry and continued for five minutes. The initial O2 flow rate was 2 L/minute. We recorded SpO2, RR, consciousness status (awake, drowsy, or asleep), existence of an airway support device (oral airway, nasal airway); the duration the patient wore the O2 mask, and the duration of PACU stay. All additional monitoring was performed with the BSM-6301A monitoring system (Nihon Kohden, SpO2 probe, MASIMO). Central venous blood samples were collected once during the time the capnography waveforms were being recorded and were tested for partial Pressure of Carbon Dioxide (PcvCO2) using the Epoc blood gas and electrolyte analysis system (Alere, Waltham, MA). To blind the investigators, separate research assistants measured mean peak expiratory CO2 and PcvCO2. Further, blood gas measurements were obtained in a separate location.
Statistical Analysis
Sample size of 40 was calculated with linear regression testing for patient factors that had an association with the measurement error at each time point, was sufficient to detect significance with 95% power. Primary analysis included assessment of agreement between peak value of exhaled CO2 (PexCO2) and central venous CO2 (PvCO2). Secondary analysis included assessment of the patient and mask characteristics that affect the measurement error at each time point as well as the performance of the cap-ONE® mask for discriminating hypercapnia. Measurement error was assessed at four time points; at the time of PvCO2 blood sampling, 0-10 seconds, 10-20 seconds, and 20-30 seconds to identify if there was a lag in PexCO2 measurements. Eight patient characteristics and one mask characteristic were assessed for association with measurement error defined as the difference in mmHg between the PexCO2 and the PvCO2. Hypercapnia defined as PvCO2 >50 mmHg was used as the gold standard while >45 mmHg was used as the threshold for hypercapnia using PexCO2 from the mask. Patient characteristics such as BMI, age, gender, and temperature were collected at pre-op while heart rate, respiratory rate, and mask size were collected at the time of PACU arrival. The relative percent change in mean arterial pressure was defined as  and was further dichotomised into >20% change or ≤20% change. Status of pre-existing conditions that might affect respiration was defined by the lead investigator based upon pre-op diagnosis and procedure performed.
Agreement between PexCO2 and PvCO2 at each time point was assessed visually using Bland-Altman plots and summary statistics describing measurement error. Univariate analysis using generalised linear modelling was used to assess each patient characteristic separately at each time point at the 0.10 significance level to determine if there was an effect on measurement error. Sensitivity, specificity, and Area Under the Curve (AUC) were used to assess the performance of the cap-ONE mask in identifying hypercapnia. All statistical analysis was performed with SAS Version 9.4 for Windows (SAS Institute Inc., Cary, NC, USA).
Results
Forty children were enrolled and analysed. All patients had an uneventful anaesthetic course and entered the PACU without respiratory compromise. Study demographics are shown in [Table/Fig-1]. Seventeen children wore small mask (age range 21-65-month-old, mean 47.7, SD 15.4; weight range 11-20 kg, mean 16, SD 2.5). Twenty-three children wore medium mask (age range 41-144 months, mean 79.8, SD 25; weight range 9-37 kg, 22.8, SD 6.2). One patient had a nasal airway in place to support airway patency at the time of capnography. Distributions of PcvCO2 were denied non-normality (p=0.81, 0.52, respectively) by skewness/kurtosis test.
Summary statistics by demographics and pre-existing condition.
| Variables | All |
|---|
| N=40 |
|---|
| Gender | | |
| Male | N (%) | 21 (52.50%) |
| Female | N (%) | 19 (47.50%) |
| Age, months | Mean±sd | 65.53±26.3± |
| Median (Q1, Q3) | 62.50 (49.0, 77.5) |
| Pre-existing Condition Affecting Respiration: | | |
| No | N (%) | 24 (60.00%) |
| Yes | N (%) | 16 (40.00%) |
| Temperature (°C), at Pre-Op | Mean±sd | 36.35±0.2 |
| Median (Q1, Q3) | 36.40 (36.2, 36.5) |
| BMI, at Pre-op | Mean±sd | 16.24±2.7 |
| Median (Q1, Q3) | 16.09 (15.1, 17.0) |
| Cap-ONE Mask Size | | |
| Small (infant) | N (%) | 17 (42.50%) |
| Medium (paediatric) | N (%) | 23 (57.50%) |
| Relative Percent Change in Mean Arterial Pressure | | |
| ≤20% | N (%) | 26 (65.00%) |
| >20% | N (%) | 14 (35.00%) |
| Heart Rate (bpm), at PACU arrival | Mean±sd | 92.25±14.8 |
| Median (Q1, Q3) | 92.50 (85.0, 98.0) |
| Respiratory Rate (breaths/min), at PACU arrival | Mean±sd | 21.33±4.0 |
| Median (Q1, Q3) | 21.00 (19.0, 23.0) |
| PcvCO2, mmHg | Mean±sd | 47.46±5.0 |
| Median (Q1, Q3) | 46.85 (43.1, 51.0) |
| Measurement Error at Time of Blood Sample, mmHg | Mean±sd | 6.14±3.2 |
| Median (Q1, Q3) | 6.35 |
| Measurement Error at 0-10 seconds, mmHg | Mean±sd | 6.08±2.1 |
| Median (Q1, Q3) | 6.17 (3.1, 8.6) |
| Measurement Error at 10-20 seconds, mmHg | Mean±sd | 5.97±2.9 |
| Median (Q1, Q3) | 6.10 (3.4, 8.3) |
| Measurement Error at 20-30 seconds, mmHg | Mean±sd | 5.88±2.9 |
| Median (Q1, Q3) | 5.88 (3.6, 8.4) |
Agreement between PvCO2 and Mask PexCO2 [Table/Fig-2a-d]: Similar differences in PvCO2-PexCO2 were found at each time point: At sampling (6.1±3.2 mmHg), 0-10 seconds (6.08±2.1 mmHg), 10-20 second (5.9±2.9 mmHg), 20-30 seconds (5.9±2.9 mmHg). Each time point displayed a larger PvCO2 mmHg than PexCO2 mmHg, on average. Bland Altman plots revealed points outside of the Limits of Agreement at the 0-10, 10-20, and 20-30 second time points while at the time of blood collection all points were within the limits of agreement. Across all time points, larger bias was seen at higher levels of PvCO2 (>55 mmHg). When identifying those with pre-existing conditions affecting respiration, the summary statistics revealed that those without had smaller measurement error at 20-30 seconds, although this was not statistically significant (p=0.18).
Bland-Altman analyses of PcvCO2 and PexCO2 at the time of blood sampling (A), 0-10 seconds after blood sampling (B), 10-20 seconds after blood sampling (C), and 20-30 seconds after blood sampling. The mean differences (bias) between PcvCO2 and PexCO2 were: (A) 6.1 mmHg±3.2 mmHg, (B) 6.1 mmHg±3.2 mmHg, (C) 6.0 mmHg±2.9 mmHg,(D) 5.9 mmHg with SD of 2.9 mmHg.

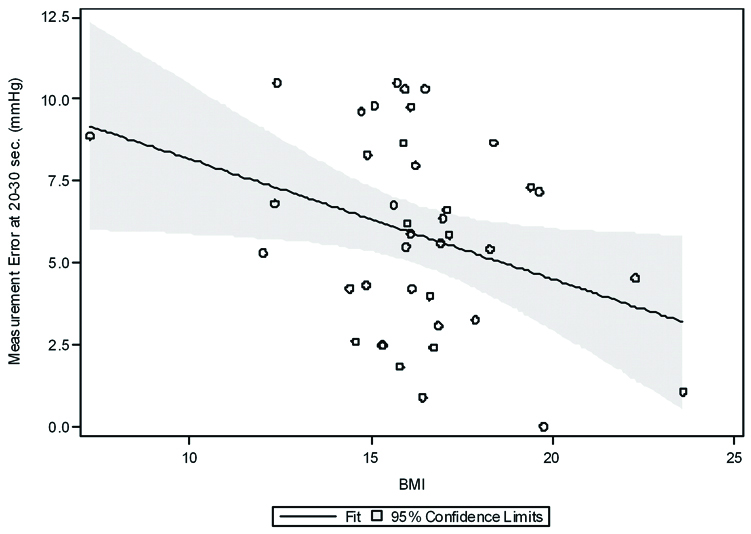
Factors that showed evidence of association (p<0.10) with measurement error from the univariate analyses at each time point are displayed in [Table/Fig-3,4]. Gender showed that there was a trend towards females having lower measurement error, on average. For females, the mean difference was 1.9 mmHg lower at the time of blood sampling (p=0.058), 1.7 mmHg lower at 0-10 seconds (p=0.094), and 1.7 mmHg lower at 20-30 seconds (p=0.071). BMI was a significant factor for predicting measurement error at 20-30 seconds (p=0.035) shown in [Table/Fig-4]. For every one unit increase in BMI, there is an average decrease in the measurement error of 0.37 mmHg, suggesting that patients with higher BMI have a closer PvCO2 and PexCO2 measured by CapOne® mask [Table/Fig-5].
Univariate results for characteristics affecting measurement error from time of sampling to 10 seconds, 10-20 seconds, 20-30 seconds.
| Measurement Error at the time of blood sampling |
|---|
| Characteristic Tested | Model Estimate | 95% C.I. | p-value |
|---|
| Gender (Female vs. Male) | -1.91 | (-3.89, 0.07) | 0.058 |
| Age (months) | 0.005 | (-0.04, 0.04) | 0.81 |
| Pre-existing condition affecting respiration (Yes vs. No) | 1.04 | (-1.06, 3.13) | 0.32 |
| Pre-Op Temperature | 3.14 | (-1.41, 7.69) | 0.17 |
| BMI | -0.21 | (-0.59, 0.17) | 0.28 |
| Mask Size (Medium vs. Small) | 0.09 | (-2.01, 2.19) | 0.93 |
| Relative percent change in Mean Arterial Pressure (>20% vs. ≤ 20%) | -0.03 | (-2.21, 2.15) | 0.98 |
| Heart Rate at PACU arrival | 0.0002 | (-0.07, 0.07) | >0.99 |
| Respiratory Rate at PACU arrival | 0.10 | (-0.16, 0.36) | 0.43 |
| Measurement Error at 0-10 seconds |
| Gender (Female vs. Male) | -1.70 | (-3.70, 0.30) | 0.09 |
| Age (months) | 0.004 | (-0.04, 0.04) | 0.84 |
| Pre-existing condition affecting respiration (Yes vs. No) | 1.06 | (-1.03, 3.15) | 0.31 |
| Pre-Op Temperature | 2.88 | (-1.69, 7.45) | 0.21 |
| BMI | -0.22 | (-0.60, 0.16) | 0.26 |
| Mask Size (Medium vs. Small) | -0.13 | (-2.23, 1.97) | 0.90 |
| Relative percent change in Mean Arterial Pressure (>20% vs. ≤ 20%) | 0.24 | (-1.93, 2.42) | 0.82 |
| Heart Rate at PACU arrival | 0.004 | (-0.07, 0.07) | 0.91 |
| Respiratory Rate at PACU arrival | 0.08 | (-0.18, 0.34) | 0.55 |
| Measurement Error at 10-20 seconds |
| Gender (Female vs. Male) | -1.40 | (-3.28, 0.48) | 0.14 |
| Age (months) | 0.01 | (-0.03, 0.05) | 0.54 |
| Pre-existing condition affecting respiration (Yes vs. No) | 1.17 | (-0.77, 3.10) | 0.23 |
| Pre-Op Temperature | 3.28 | (-0.93, 7.49) | 0.12 |
| BMI | -0.27 | (-0.63, 0.08) | 0.12 |
| Mask Size (Medium vs. Small) | 0.35 | (-1.60, 2.31) | 0.72 |
| Relative percent change in Mean Arterial Pressure (>20% vs. ≤ 20%) | 0.11 | (-1.91, 2.14) | 0.91 |
| Heart Rate at PACU arrival | 0.01 | (-0.06, 0.07) | 0.78 |
| Respiratory Rate at PACU arrival | 0.04 | (-0.20, 0.28) | 0.73 |
| Measurement Error at 20-30 seconds |
| Gender (Female vs. Male) | -1.68 | (-3.52, 0.15) | 0.071 |
| Age (months) | 0.01 | (-0.03, 0.05) | 0.59 |
| Pre-existing condition affecting respiration (Yes vs. No) | 1.31 | (-0.60, 3.22) | 0.17 |
| Pre-Op Temperature | 2.67 | (-1.55, 6.88) | 0.21 |
| BMI | -0.37 | (-0.71, -0.03) | 0.035 |
| Mask Size (Medium vs. Small) | 0.28 | (-1.66, 2.22) | 0.77 |
| Relative percent change in Mean Arterial Pressure (>20% vs. ≤ 20%) | -0.12 | (-2.13, 1.89) | 0.90 |
| Heart Rate at PACU arrival | 0.02 | (-0.05, 0.08) | 0.62 |
| Respiratory Rate at PACU arrival | 0.07 | (-0.16, 0.31) | 0.53 |
Predicted Measurement Error at 20-30 seconds after blood sampling by BMI. BMI was a significant factor for predicting measurement error at 20-30 seconds (p=0.035). For every one unit increase in BMI, there is an average decrease in the measurement error of 0.37 mmHg.
Univariate results for characteristics affecting measurement error from time of 10-30 seconds.
| Measurement Error at the time of blood sampling |
|---|
| Characteristic Tested | Model Estimate | 95% C.I. | p-value |
|---|
| Gender (Female vs. Male) | -1.91 | (-3.89, 0.07) | 0.058 |
| Age (months) | 0.005 | (-0.04, 0.04) | 0.81 |
| Pre-existing condition affecting respiration (Yes vs. No) | 1.04 | (-1.06, 3.13) | 0.32 |
| Pre-Op Temperature | 3.14 | (-1.41, 7.69) | 0.17 |
| BMI | -0.21 | (-0.59, 0.17) | 0.28 |
| Mask Size (Medium vs. Small) | 0.09 | (-2.01, 2.19) | 0.93 |
| Relative percent change in Mean Arterial Pressure (>20% vs. ≤ 20%) | -0.03 | (-2.21, 2.15) | 0.98 |
| Heart Rate at PACU arrival | 0.0002 | (-0.07, 0.07) | >0.99 |
| Respiratory Rate at PACU arrival | 0.10 | (-0.16, 0.36) | 0.43 |
| Measurement Error at 0-10 seconds |
| Gender (Female vs. Male) | -1.70 | (-3.70, 0.30) | 0.09 |
| Age (months) | 0.004 | (-0.04, 0.04) | 0.84 |
| Pre-existing condition affecting respiration (Yes vs. No) | 1.06 | (-1.03, 3.15) | 0.31 |
| Pre-Op Temperature | 2.88 | (-1.69, 7.45) | 0.21 |
| BMI | -0.22 | (-0.60, 0.16) | 0.26 |
| Mask Size (Medium vs. Small) | -0.13 | (-2.23, 1.97) | 0.90 |
| Relative percent change in Mean Arterial Pressure (>20% vs. ≤ 20%) | 0.24 | (-1.93, 2.42) | 0.82 |
| Heart Rate at PACU arrival | 0.004 | (-0.07, 0.07) | 0.91 |
| Respiratory Rate at PACU arrival | 0.08 | (-0.18, 0.34) | 0.55 |
| Measurement Error at 10-20 seconds |
| Gender (Female vs. Male) | -1.40 | (-3.28, 0.48) | 0.14 |
| Age (months) | 0.01 | (-0.03, 0.05) | 0.54 |
| Pre-existing condition affecting respiration (Yes vs. No) | 1.17 | (-0.77, 3.10) | 0.23 |
| Pre-Op Temperature | 3.28 | (-0.93, 7.49) | 0.12 |
| BMI | -0.27 | (-0.63, 0.08) | 0.12 |
| Mask Size (Medium vs. Small) | 0.35 | (-1.60, 2.31) | 0.72 |
| Relative percent change in Mean Arterial Pressure (>20% vs. ≤ 20%) | 0.11 | (-1.91, 2.14) | 0.91 |
| Heart Rate at PACU arrival | 0.01 | (-0.06, 0.07) | 0.78 |
| Respiratory Rate at PACU arrival | 0.04 | (-0.20, 0.28) | 0.73 |
| Measurement Error at 20-30 seconds |
| Gender (Female vs. Male) | -1.68 | (-3.52, 0.15) | 0.071 |
| Age (months) | 0.01 | (-0.03, 0.05) | 0.59 |
| Pre-existing condition affecting respiration (Yes vs. No) | 1.31 | (-0.60, 3.22) | 0.17 |
| Pre-Op Temperature | 2.67 | (-1.55, 6.88) | 0.21 |
| BMI | -0.37 | (-0.71, -0.03) | 0.035 |
| Mask Size (Medium vs. Small) | 0.28 | (-1.66, 2.22) | 0.77 |
| Relative percent change in Mean Arterial Pressure (>20% vs. ≤ 20%) | -0.12 | (-2.13, 1.89) | 0.90 |
| Heart Rate at PACU arrival | 0.02 | (-0.05, 0.08) | 0.62 |
| Respiratory Rate at PACU arrival | 0.07 | (-0.16, 0.31) | 0.53 |
Sensitivity/Specificity Analysis in Testing for Hypercapnia: Based on PvCO2 levels obtained from the blood draw, 13 out of the 40 patients had CO2 levels above 50 and were assumed to have hypercapnia. Using 45 as a threshold for PexCO2 levels, we conducted sensitivity and specificity tests to determine how well the mask can detect hypercapnia at different times.
Discrimination of hypercapnia at each time point is summarised in [Table/Fig-6]. Measurements are: at sampling (sensitivity 77%, specificity 96%), 0-10 seconds (sensitivity 77%, specificity 89%), 10-20 seconds (sensitivity 69%, specificity 93%), and 20-30 seconds (sensitivity 77%, specificity 89%).
Exhaled CO2 discrimination of hypercapnia at each time point.
| Time Point | Sensitivity | Specificity | AUC |
|---|
| At the time of blood sampling | 77% | 96% | 0.866 |
| 0-10 seconds | 77% | 89% | 0.829 |
| 10-20 seconds | 69% | 93% | 0.809 |
| 20-30 seconds | 77% | 89% | 0.829 |
*True hypercapnia was defined at PcvCO2>50 mmHg while the mask threshold (PexCO2) was >45 mmHg.
The AUC was 0.866 at blood draw, 0.829 at 0-10 seconds, 0.809 at 10-20 seconds, and 0.829 at 20-30 seconds. This suggests the PexCO2 measurement taken at blood draw was the most accurate in testing for hypercapnia. However, it is worth mentioning that three patients had EtCO2 levels of exactly 45 at that point, which barely identified them as true negatives and significantly increased the AUC at that point.
Discussion
We found that peak exhaled CO2 (PexCO2) measured by mainstream mask capnography system (cap-ONE®) correlated well with PvCO2 measured with a central venous blood gas (PcvCO2). Univariate analyses showed that BMI was the only significant factor for predicting measurement error between PcvCO2 and PexCO2. When PcvCO2 >50 mmHg and PexCO2 >45 mmHg from the mask was used as the threshold for hypercapnia, sensitivity, specificity, and AUC indicated good reliability of this device detecting hypercarbia. We believe that the mainstream mask capnography device could be used to monitor for hypoventilation and hypercarbia in children recovering from anaesthesia.
In our previous study, we compared the precision of mainstream mask (cap-ONE®) capnography and side-stream nasal cannula capnography in non-intubated children in a PACU setting [12]. Measurement of PexCO2 values by mainstream mask system showed a normal distribution with a smaller SD and was less affected by O2 flow change than side stream sampling in predictable fashion. The difference in average CO2 values between O2 flow rates of 0.25 L/minute and 2 L/minute was 0.8 mmHg whereas the difference in average CO2 between O2 flow rates of 0.25 L/minute and 5 L/minute was 2.0 mmHg. We used this prior information to choose 2 L/minute as the flow rate for this study. We chose to compare PexCO2 to blood gas values drawn from a central venous line (PcvCO2). Normally, when the PCO2 is measured invasively, there is a slight discrepancy between blood values and exhaled CO2 due to dead space of the lung and bronchial tree regardless of intubated or non-intubated patients. Neonates and infants were reported to smaller blood-exhaled PCO2 differences than older counterparts [13]. Arterial blood gas measurement of carbon dioxide (PaCO2) is considered the gold standard. However, collecting arterial blood samples in non-anesthetised children in PACU is technically challenging. In adults, several authors have compared PaCO2 to PvCO2 drawn centrally and/or from peripheral venous blood [14-16]. In general, PCO2 of central venous blood and peripheral venous blood correlated well to arterial PCO2. Arterial PCO2 is consistently lower than central venous and peripheral venous PCO2 as expected since CO2 is transported from pulmonary arterial blood to alveoli [8,14-17]. The differences between central venous PCO2 and arterial PCO2 are consistently smaller than those between arterial and peripheral venous PCO2 [8,16,17]. Given this information and ease of use we chose central venous blood as a standard of PCO2 measurement in examining accuracy of peak exhaled CO2 measurement by the mainstream mask system.
When capnography is used to evaluate the end-tidal concentration of CO2, it must be interpreted in conjunction with other clinical findings such as the work of breathing, CO2 transport and elimination as well as changes in cardiac output. In non-intubated adult patients, a mainstream compared with a side-stream capnography system better reflected arterial PCO2 measurements. Although the patient population was healthy, capnometry may not correctly identify hypercarbia in the presence of lung disease (e.g., high V/Q mismatch) or small tidal volumes, factors commonly found in sicker patients [9]. In our study, we examined children without any acute respiratory compromise after short minor surgical procedures. There were children with pre-existing condition potentially affecting respiration but all were stable and asymptomatic at the time of testing. Therefore, we feel the work of breathing was not significantly altered by the surgical procedure or intraoperatively administered narcotic medications. We examined nine factors (gender, age, pre-existing condition affecting respiration, pre-operative temperature, BMI, Relative percent change on mean arterial pressure between preoperative and postoperative value, heart rate and Respiratory rate at PACU arrival, and mask size) and four different time points of PexCO2 measurement for association with measurement error. BMI was the only significant factor for predicting measurement error at 20-30 seconds (p=0.035). However, our data only contain BMI lower than 25 meaning no obese children were involved in our study. In adult study by Kasuya Y et al., accuracy in non-obese and obese patients, with and without OSA, was similar in arterial-to-end-tidal partial pressure difference in mainstream capnography [9].
We tested mainstream capnography mask system to detect hypercapnia [Table/Fig-3]. Using PcvCO2 of 50 mmHg and PexCO2 of 45 mmHg as hypercapnia threshold, the AUC was 0.809 to 0.866 at each time points of peak exhaled CO2 measurement. Mainstream mask capnography seems useful device to discriminate hypercapnia in non-intubated children.
Limitation
There are several potential limitations to the study. There are a limited number of children with relatively minor respiratory problems; however, there were strong correlations between measurements and the Bland-Altman plots did not show any systematic bias at any time points of peak exhaled CO2 measurement including hypercapnic children. We were able to compare only the exhaled CO2 values to central venous blood gas at one oxygen flow rate but from our prior study a higher flow rate did not provide a significantly greater amount of bias (2 vs 5 L/minute flow). The difference in average CO2 values between O2 flow rates of 2 L/minute and 5 L/minute was 1.2 mmHg.
Conclusion
This is the first study to assess the accuracy of a mainstream mask capnography system specifically designed for children with different body weights to central venous PCO2. We conclude that mainstream mask capnography is a reliable device to assess hypoventilation and hypercapnia in non-intubated children.
*True hypercapnia was defined at PcvCO2>50 mmHg while the mask threshold (PexCO2) was >45 mmHg.