Achondroplasia (ACH) is an autosomal dominant genetic disease which is the most common form of non-lethal skeletal dysplasias. ACH is caused due to obtrusion in the mechanisms of proliferation and differentiation of the growth plate chondrocytes, which hinders the growth of endochondrial bone [1,2]. It affects more than 250,000 people worldwide [3]. The incidence rate of ACH is about 1/15-40,000 live births worldwide [4].
Patients with ACH present with disproportionate short stature with rhizomelic shortening of the limbs, large head with frontal bossing, and midface hypoplasia. They have a long narrow trunk, short broad hands, and exhibit a three-pronged (trident) configuration. They experience hyperextensibility of multiple joints; except the elbows [5]. ACH patients have delayed motor milestones and increased the frequency of recurrent ear infections. They develop bow legs in the long run [6,7]. ACH patients develop obesity with associated conditions like obstructive sleep apnea. Patients may often develop genu varus, lumbar lordosis and spinal stenosis [8].
ACH is caused by a gene mutation that encodes the transmembrane receptor; Fibroblast Growth Factor Receptor 3 (FGFR3). This gene plays a major role in regulating the linear bone growth. The FGFR3 gene is expressed at different stages of development in tissues such as cartilage, brain, intestine, and kidneys. The FGFR3 gene mutation results in impaired proteins which affect the process of chondrocyte proliferation and calcification and hinders the cartilage growth and maturation. This, in turn, leads to the appearance of the characteristic clinical manifestations of ACH [9].
Growth charts specially designed for patients with ACH are essential tools for medical follow-up, and to detect deviation from the expected growth pattern with early identification of any pathology leading to delayed growth. They are also useful to monitor the treatments effects on growth. Some countries have constructed growth charts for ACH such as: USA, Argentina and Japan [8,10-14].
Since the growth of patients with ACH is recommended to be plotted on ACH growth charts specific to ethnic groups and/or nationalities; the aim of the present work was to evaluate the patterns of growth in Egyptian patients with ACH by plotting specific growth chart.
Materials and Methods
This was a cross-sectional study conducted from March 2014 to September 2017. Patients diagnosed as ACH were recruited from the Department of Clinical Genetics; National Research Centre in Egypt. The purpose and importance of the study were explained to the parent or caregiver and informed written consent was obtained from all the participants’ parents.
The study was approved by the Ethical Research Committee of the National Research Centre (NRC), (No: 13176) and was conducted in accordance with NRC bylaws for human research. It conforms to the provisions of the Declaration of Helsinki in 2000.
The present study was based on observations of 327 patients with ACH; (186 males and 141 females) aged one to eight years. Patients were divided into seven groups of male and female. The referred patients were all Egyptians, coming from different areas of Egypt. Subjects were divided into male and female groups and sub-grouped into age groups (one year apart), ranging from one to eight years.
Inclusion and Exclusion Criteria
The inclusion criteria for the study; patients were selected depending on the clinical criteria of ACH like: short stature with rhizomelic limb shortening, frontal bossing, midface hypoplasia, short broad hands with trident fingers. This was followed by the radiological findings including: large skull, short long bones, genu varus, kyphoscoliosis and loss of caudal widening. It was confirmed by molecular diagnosis. DNA samples were extracted from peripheral blood samples and FGFR3 gene was amplified and sequenced to all patients to confirm the clinical diagnosis according to Shiang R et al., [15]. All the patients were found to have a heterozygous mutation of the FGFR3 gene.
The exclusion criteria for the study; none of the patients received growth hormone or subjected to lengthening intervention.
To avoid any patient being over-represented in the dataset; not more than two measures (one year apart) were included for any patient over the period of the study. Patients were compared with control group of age and sex-matched healthy male and female Egyptian children, who had a normal size at birth, no malformation, and no chronic medical conditions. Control data were derived from measurements taken from the Egyptian Growth Curve reference data 2002 [16]. Each patient was subjected to constructed and detailed pedigree analysis, meticulous clinical examination, and anthropometric measurements. Growth parameters (weight, length/height, and head circumference) were measured by two trained physicians along with staff attendant, who helped in alignment and immobilisation of the patient during evaluation.
All anthropometric measurements were taken as per the recommendations of the International Biological Publications, using standardised types of equipments [17,18]. They were recorded as the mean of three accepted consecutive readings. Body weight was taken, using Seca scale approximated to the nearest 0.01 kg with minimal clothes.
For children <3 years, the length was measured using an infantometer. For children >3 years, the height was measured without shoes using Holtain Stadiometer. In both cases, measurements were approximated to the nearest 0.1 cm. The measurement of maximum head circumference was taken using a non-stretchable tape from the occiput passing above but not including the brow ridge.
Means and standard deviation (SD) of evaluated growth measurements were calculated for each age and sex separately. They were graphically smoothed using polynomial fitting equation according to Baker LA et al., [19]. The growth curves of weight, length, and head circumference from one to eight years with means and ±1 and 2 SDs were plotted.
Statistical Analysis
The collected data were coded, tabulated, and statistically analysed using IBM Statistical Package for Social Sciences (SPSS) statistics software version 18.0. Descriptive statistics were done for quantitative data as minimum and maximum of the range, as well as mean±SD. Inferential analyses were done using independent t-test. The level of significance was taken at p-value <0.05.
Results
All patients shared the consistent clinical manifestations and skeletal changes of ACH. Clinically they presented with short stature, short limbs, macrocephaly, frontal bossing, mid-face hypoplasia, long narrow trunk, short and broad hands. In addition; ACH patients’ joints were hyperextensible, especially the knees with a limitation of elbow extension and rotation. Skeletal X-ray survey illustrated the rhizomelic shortening of the long bones, genu varum, and loss of caudal widening. Patients with ACH had delayed motor developmental milestones which improved by age with normal mental development.
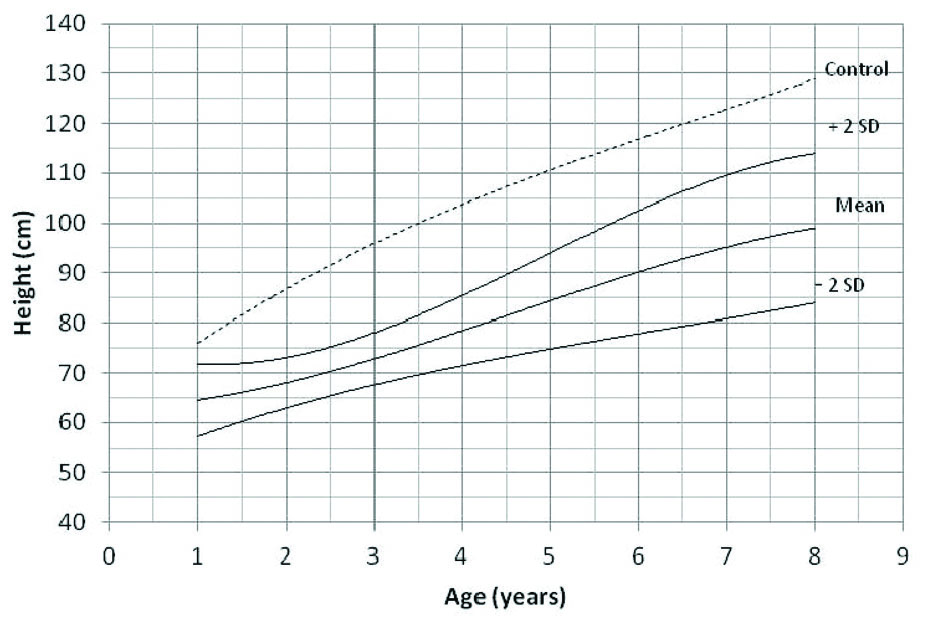
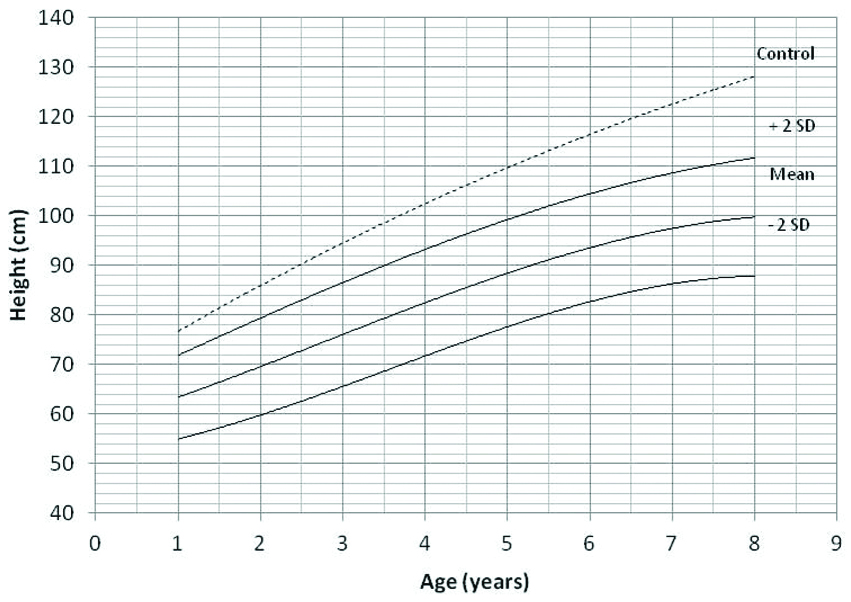
The height of ACH patients both male and female in all age groups were found to be significantly (p-value<0.001) lower than their control counterparts [Table/Fig-1,2 and 3].
Mean values and standard deviation (SD) for height (cm) in ACH and controls.
| Age (years) | Sex | Case | Control | p-value |
|---|
| N | Mean±SD | N | Mean±SD |
|---|
| 1.0 | Male | 25 | 66.6±7.5 | 27 | 77.1±5.0 | <0.001* |
| Female | 19 | 66.1±4.6 | 17 | 77.8±5.3 | <0.001* |
| Total | 44 | 66.3±6.4 | 44 | 77.3±5.1 | <0.001* |
| 2.0 | Male | 26 | 69.6±4.1 | 24 | 83.8±5.9 | <0.001* |
| Female | 19 | 68.6±4.6 | 21 | 85.2±5.0 | <0.001* |
| Total | 45 | 69.2±4.3 | 45 | 84.5±5.5 | <0.001* |
| 3.0 | Male | 34 | 75.5±5.2 | 41 | 93.2±5.9 | <0.001* |
| Female | 27 | 73.9±6.2 | 20 | 93.5±3.9 | <0.001* |
| Total | 61 | 74.8±5.7 | 61 | 93.3±5.3 | <0.001* |
| 4.0 | Male | 34 | 80.3±5.8 | 29 | 101.4±7.9 | <0.001* |
| Female | 26 | 78.8±7.3 | 31 | 101.3±5.5 | <0.001* |
| Total | 60 | 79.6±6.5 | 60 | 101.4±6.7 | <0.001* |
| 5.0 | Male | 41 | 85.2±8.0 | 39 | 110.0±7.6 | <0.001* |
| Female | 33 | 88.5±6.7 | 35 | 109.9±7.0 | <0.001* |
| Total | 74 | 86.7±7.6 | 74 | 110.0±7.3 | <0.001* |
| 6.0 | Male | 14 | 94.9±8.5 | 16 | 119.2±9.7 | <0.001* |
| Female | 11 | 91.1±8.6 | 9 | 121.4±8.1 | <0.001* |
| Total | 25 | 93.2±8.6 | 25 | 120.0±9.0 | <0.001* |
| 7.0-8.0 | Male | 12 | 101.9±4.5 | 10 | 128.1±9.6 | <0.001* |
| Female | 6 | 100.1±6.0 | 8 | 130.6±9.3 | <0.001* |
| Total | 18 | 101.3±5.0 | 18 | 129.2±9.3 | <0.001* |
| Total | Male | 186 | 79.6±11.7 | 186 | 98.6±16.2 | <0.001* |
| Female | 141 | 78.9±11.5 | 141 | 100.0±15.6 | <0.001* |
| Total | 327 | 79.3±11.6 | 327 | 99.2±15.9 | <0.001* |
*p-value <0.001 statistically significant, Student’s Independent t-test
Height growth charts (mean±2 SD) for males with Achondroplasia, 1-8 years (solid lines) and mean height for normal Egyptian male controls (dotted line).
Height growth charts (mean±2 SD) for females with Achondroplasia, 1-8 years (solid lines) and mean height for normal Egyptian female controls (dotted line).
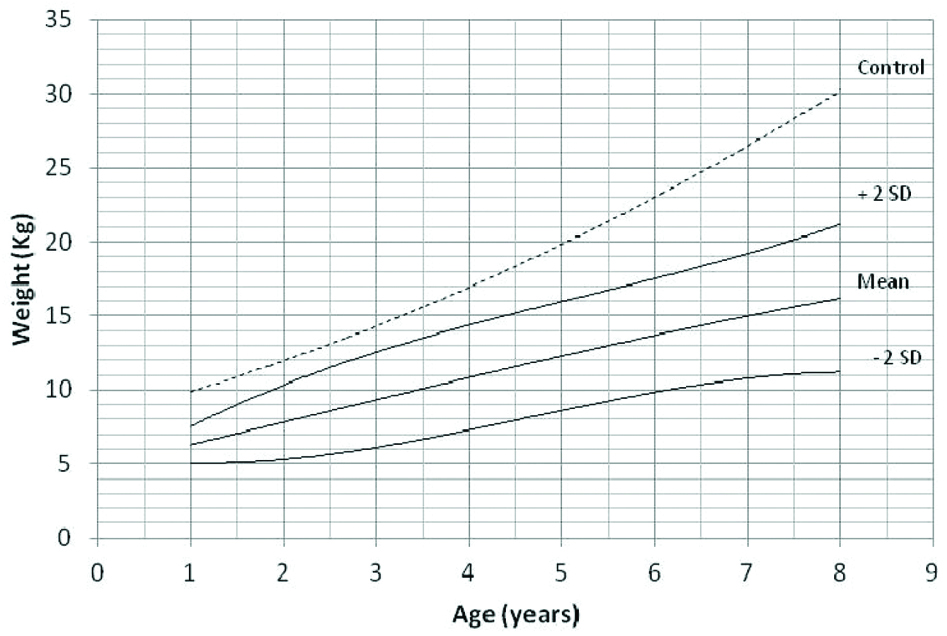
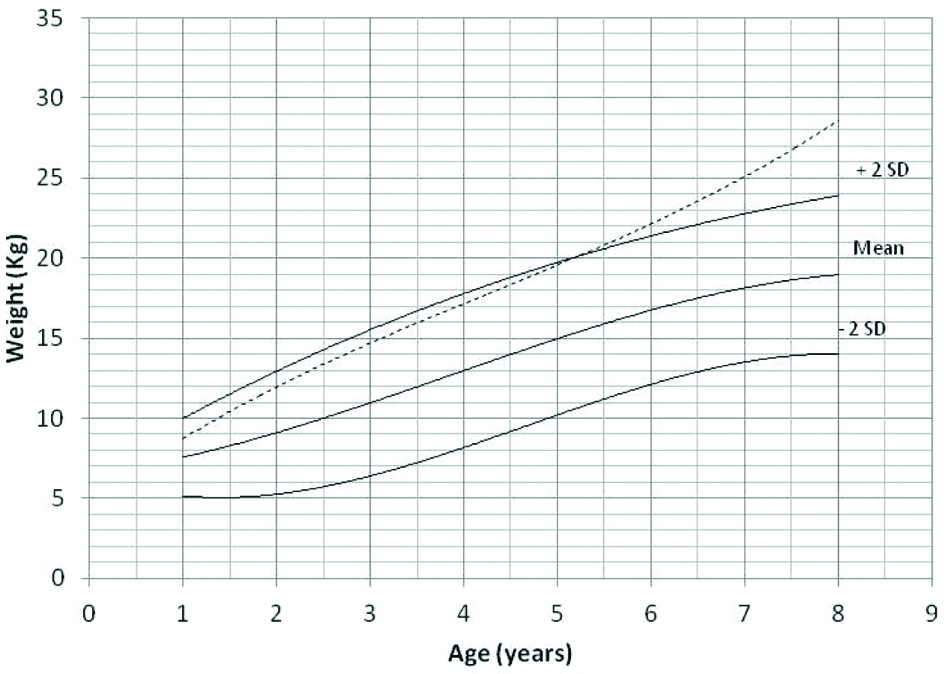
The mean values and SD for weight in ACH and the controls are shown in [Table/Fig-4,5 and 6]. The [Table/Fig-4] shows a significant difference between ACH and the controls. The [Table/Fig-5] shows that the means of male weight patients with ACH were below that of the controls while [Table/Fig-6] shows an overlap between ±2SD female patients curve and the controls mean curve till six years with a tendency to near normal then it progressively starts to be lower than the controls with advancing age.
Mean values and standard deviation (SD) for weight (kg) in ACH and controls
| Age (years) | Sex | Case | Control | ^p-value |
|---|
| N | Mean±SD | N | Mean±SD |
|---|
| 1.0 | Male | 25 | 10.0±4.0 | 27 | 14.9±1.9 | <0.001* |
| Female | 19 | 9.7±2.8 | 17 | 15.2±1.9 | <0.001* |
| Total | 44 | 9.9±3.5 | 44 | 15.0±1.9 | <0.001* |
| 2.0 | Male | 26 | 11.9±2.1 | 24 | 17.2±1.9 | <0.001* |
| Female | 19 | 11.2±2.7 | 21 | 17.7±1.5 | <0.001* |
| Total | 45 | 11.6±2.3 | 45 | 17.4±1.7 | <0.001* |
| 3.0 | Male | 34 | 14.3±2.0 | 41 | 20.0±1.6 | <0.001* |
| Female | 27 | 13.6±2.6 | 20 | 20.1±1.0 | <0.001* |
| Total | 61 | 14.0±2.3 | 61 | 20.0±1.4 | <0.001* |
| 4.0 | Male | 34 | 16.1±2.1 | 29 | 22.1±2.0 | <0.001* |
| Female | 26 | 15.4±2.7 | 31 | 22.1±1.4 | <0.001* |
| Total | 60 | 15.8±2.4 | 60 | 22.1±1.7 | <0.001* |
| 5.0 | Male | 41 | 17.6±2.5 | 39 | 24.3±2.1 | <0.001* |
| Female | 33 | 18.7±2.0 | 35 | 24.3±1.9 | <0.001* |
| Total | 74 | 18.1±2.3 | 74 | 24.3±2.0 | <0.001* |
| 6.0 | Male | 14 | 20.5±2.2 | 16 | 26.8±2.5 | <0.001* |
| Female | 11 | 19.3±2.4 | 9 | 27.5±2.1 | <0.001* |
| Total | 25 | 20.0±2.3 | 25 | 27.0±2.4 | <0.001* |
| 7.0-8.0 | Male | 12 | 22.2±1.2 | 10 | 29.5±3.3 | <0.001* |
| Female | 6 | 21.7±1.3 | 8 | 30.3±3.2 | <0.001* |
| Total | 18 | 22.0±1.2 | 18 | 29.9±3.2 | <0.001* |
| Total | Male | 186 | 15.4±4.2 | 186 | 21.2±4.6 | <0.001* |
| Female | 141 | 15.1±4.3 | 141 | 21.7±4.3 | <0.001* |
| Total | 327 | 15.3±4.3 | 327 | 21.4±4.5 | <0.001* |
*p-value <0.001 statistically significant, Student’s Independent t-test
Weight growth charts (mean±2 SD) for males with Achondroplasia, 1-8 years (solid lines) and mean weight for normal Egyptian male controls (dotted line).
Weight growth charts (mean±2 SD) for females with Achondroplasia, 1-8 years (solid lines) and mean weight for normal Egyptian female controls (dotted line).
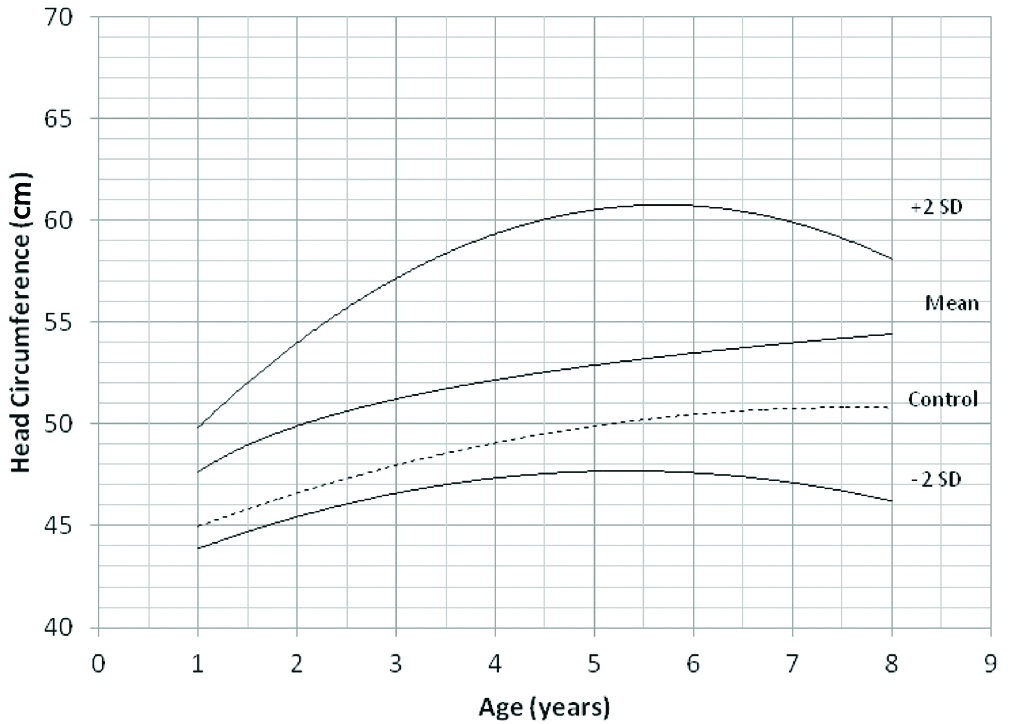
The [Table/Fig-7] shows the mean values and SD for head circumference in ACH and the controls with a significant difference in older age groups (starting at three years of age). The mean values and SD for head circumference charts compared with the controls are shown in [Table/Fig-8] (for males) and [Table/Fig-9] (for females). They represent that the controls curve lied between the mean and ±2SD curves. Such findings indicate relative macrocephaly in patients with ACH.
Mean values and standard deviation (SD) for head circumference (cm) in ACH and controls.
| Age (years) | Sex | Case | Control | ^p-value |
|---|
| N | Mean±SD | N | Mean±SD |
|---|
| 1.0 | Male | 25 | 46.2±1.1 | 27 | 46.4±1.2 | 0.501 |
| Female | 19 | 46.0±1.4 | 17 | 46.5±1.0 | 0.212 |
| Total | 44 | 46.1±1.2 | 44 | 46.4±1.1 | 0.170 |
| 2.0 | Male | 26 | 48.0±0.9 | 24 | 47.9±0.8 | 0.798 |
| Female | 19 | 48.3±0.8 | 21 | 48.1±0.7 | 0.448 |
| Total | 45 | 48.1±0.9 | 45 | 48.0±0.8 | 0.555 |
| 3.0 | Male | 34 | 49.9±1.2 | 41 | 49.3±0.7 | 0.008* |
| Female | 27 | 49.7±1.2 | 20 | 49.3±0.5 | 0.101 |
| Total | 61 | 49.8±1.2 | 61 | 49.3±0.7 | 0.002* |
| 4.0 | Male | 34 | 51.7±2.2 | 29 | 50.2±0.8 | 0.001* |
| Female | 26 | 50.3±2.5 | 31 | 50.2±0.6 | 0.833 |
| Total | 60 | 51.1±2.4 | 60 | 50.2±0.7 | 0.008* |
| 5.0 | Male | 41 | 52.5±1.7 | 39 | 50.9±0.8 | <0.001* |
| Female | 33 | 52.4±1.5 | 35 | 50.8±0.8 | <0.001* |
| Total | 74 | 52.4±1.6 | 74 | 50.9±0.8 | <0.001* |
| 6.0 | Male | 14 | 52.9±1.8 | 16 | 51.2±1.0 | 0.003* |
| Female | 11 | 53.9±1.4 | 9 | 51.5±0.8 | <0.001* |
| Total | 25 | 53.4±1.7 | 25 | 51.3±0.9 | <0.001* |
| 7.0-8.0 | Male | 12 | 54.6±0.6 | 10 | 51.6±0.9 | <0.001* |
| Female | 6 | 53.4±1.4 | 8 | 51.7±0.8 | 0.015* |
| Total | 18 | 54.2±1.1 | 18 | 51.6±0.9 | <0.001* |
| Total | Male | 186 | 50.6±2.9 | 186 | 49.4±1.9 | <0.001* |
| Female | 141 | 50.2±2.8 | 141 | 49.6±1.7 | 0.034* |
| Total | 327 | 50.4±2.9 | 327 | 49.5±1.8 | <0.001* |
*p-value <0.001 statistically significant, Student’s Independent t-test
Head circumference charts (mean±2 SD) for males with Achondroplasia, 1-8 years (solid lines) and mean head circumference for normal Egyptian male controls (dotted line).

Head circumference charts (mean±2 SD) for females with Achondroplasia, 1-8 years (solid lines) and mean head circumference for normal Egyptian female controls (dotted line).
Discussion
Growth of an individual is affected by genes, nutritional status and general health and environment factors, therefore varies among national and ethnic groups. The population and syndrome-specific growth charts can be used as clinical marker for predicting an individual’s health to reduce risk of misdiagnosis of microcephaly or macrocephaly in children [3]. Therefore, the present study was designed construct specific reference growth charts for Egyptian achondroplasia patients in the age group of 1-8 years. The study was the very first of its kind, carried out to plot growth charts for the basic clinical needs of monitoring the physical development of patients having ACH and to detect any deviation in their growth particularly, head circumference. These growth charts were also helpful to assess any potential growth accelerating treatment.
In the present cohort, ACH was diagnosed on the basis of clinical findings and was confirmed by molecular studies. All the cases under study had typical facial features of large head with frontal bossing, flattened nasal bridge and midface hypoplasia along with disproportionate short stature and shortened rhizomelic limbs.
Individuals with ACH have well documented growth retardation with severe height affection [12]. For height measurements, a significant decrease in the values was observed in the present patients compared to the controls in both sexes and in all age groups. Height among children with ACH is particularly compromised during the periods of most rapid growth infancy and early childhood. The present growth curve was similar to Horton WA et. al. curves of USA infants and children ACH patients [10]. Hoover-Fong J et al. reported lower height velocity in infancy and throughout puberty and found that the difference in height between individuals of average stature and those with ACH became more evident in both sexes as both approached puberty [12]. Del Pino M et al. reported higher height affection was seen during adolescence as compared to infancy and early childhood in Argentine ACH children [13]. And Tachibana K et. al., also reported similar trends, in Japanese ACH children [14].
The weight measurements showed below average weight in male patients with ACH compared to the control group. This finding was in agreement with previous studies stating failure to gain appropriate weight, especially in infancy and early childhood [20,21]. In the present study, an observable weight gain was recorded in the female patients below the age of six. This could be explained by the higher tendency of females to gain weight. Sudden weight loss or inability to gain weight leads to long-term complications such as restrictive lung disease, obstructive sleep apnea, gastro-esophageal reflux, and malabsorption. Stokes DC et al. reported severe respiratory complications in infants and young children with ACH [22]. Various studies reported an inability to gain weight due to serious complications resulting from hydrocephalus, compression of the cranio-cervical junction, obstruction of the upper airways, and thoraco-lumbar kyphosis [23,24]. However, some studies reported weight gain and obesity in ACH patients in early childhood years [13,25].
In the present study, authors observed relative macrocephaly in both male and female ACH patients as compared to the matched controls. Patients with ACH have relative macrocephaly, in association with a small skull base with narrowing of the subarachnoid space at the level of the foramen magnum leading to elevated venous pressure which hinders the absorption of cerebrospinal fluid resulting in communicating hydrocephalus. Predominantly, it is a benign process that requires no interventions but, in some cases, mechanical obstruction of cerebrospinal fluid circulation occurs due to compression deformities of the cervico-medullary junction [26]. These findings suggests importance of early and rapid detection of the accelerated head growth by plotting head circumference measurements on the growth charts. In the present study, a significant difference in the head circumference was observed in children at the age of 3-4 years. This could be due to the rapid growth of the brain in the first two years of life making no change in differences but the difference becomes more obvious with decrease in the brain growth in the following years. In contrast, a study done by Del Pino M et al. reported lower head circumference for individuals aged 0-6 years with ACH [13].
The growth charts constructed were used for monitoring the health status of ACH patients as a part of their regular follow-ups. Egyptian growth charts were in-accordance with the previously published data except for female weight in infancy and early childhood. References presented here can benefit other countries with similar ethnographic characteristics.
Limitation
There was a paucity in patients of older age groups (>8 years), which made it difficult to follow them through puberty and construct a growth chart for adolescents. Further studies on ACH patients older than 8 years of age and infants (0-12 months) are highly recommended.
Conclusion
The study highlights the importance of construction and use of population and ethnic group-specific growth charts. These established charts for patients with genetic diseases like ACH are useful tools to detect any associated factors that may affect growth. They are also valuable for identifying and selecting patients who are in need of further evaluation to detect the aetiology of the deviation from their normal basics. In addition, growth curves are useful for evaluating the effect of growth-promoting treatments.
*p-value <0.001 statistically significant, Student’s Independent t-test
*p-value <0.001 statistically significant, Student’s Independent t-test
*p-value <0.001 statistically significant, Student’s Independent t-test