Comparison of Tacrolimus and Sirolimus Based Regimens on Regulatory T Cell Levels in Renal Transplant Recipients: A Study from a Tertiary Care Centre in Kerala, India
Roshan Nasimudeen1, Saji Francis2, Melemadathil Sreelatha3, Sathi Puthenparambath4
1 Senior Resident, Department of Pathology, Government Medical College, Kozhikode, Kerala, India.
2 Associate Professor, Department of Pathology, Government Medical College, Kozhikode, Kerala, India.
3 Professor and Head, Department of Nephrology, Government Medical College, Kozhikode, Kerala, India.
4 Professor and Head, Department of Pathology, Government Medical College, Kozhikode, Kerala, India.
NAME, ADDRESS, E-MAIL ID OF THE CORRESPONDING AUTHOR: Dr. Saji Francis, Kozhimannil House, P.O Kottamparamba, Kozhikode-673008, Kerala, India.
E-mail: drsajijose@gmail.com
Introduction
A subset of CD4 lymphocytes known as regulatory T (Treg) cells is known to downregulate the immune system. If their levels are raised, immune tolerance can be increased. It was seen that certain drugs like tacrolimus (calcineurin inhibitor) and sirolimus (mTOR inhibitor) used for immunosuppression in renal transplant recipients influenced the Treg counts.
Aim
To evaluate the varied effect of calcineurin inhibitors and mTOR inhibitors on the peripheral blood Treg count in renal transplant recipients. We also sought to find the Treg cell levels in the general population.
Materials and Methods
It was a cross-sectional comparative study conducted on renal transplant recipients. The study included 58 subjects, of which 36 were renal transplant recipients on immunosuppressive regimens. Among these 21 were on tacrolimus and 15 on sirolimus. The remaining 22 individuals were healthy controls. Immunophenotyping with flow cytometry was done on peripheral blood of the study subjects and their Treg levels ascertained. Data was analysed using SPSS software, version 18.
Results
The mean percentage of regulatory T cells in patients on tacrolimus, sirolimus and the control population were 13.1±7.8%, 13.4±5.6% and 11.9±5.4%, respectively of the CD4 lymphocytes. There were no statistically significant differences between the three groups with a p-value of 0.75.
Conclusion
Immunosuppression with tacrolimus or sirolimus based regimens did not influence the Treg cell levels. The regulatory T cell levels in patients on these regimens were similar to the healthy control population.
Calcineurin inhibitors, Flow cytometry, Immune tolerance, Immunosuppression
Introduction
End stage renal disease causes lot of morbidity and mortality, which may be considerably reduced by renal transplantation. A major concern however is, the lifelong requirement for immunosuppression maintenance to prevent allograft rejection. These drugs apart from having many side effects, also predisposes the patients for opportunistic infections. A newly proposed method to counter this problem is to induce immune tolerance [1].
Recently, a subset of CD4 lymphocytes known as regulatory T cells was found to downregulate the immune system [2]. If their levels are more, immune tolerance can be increased. So if Treg cell levels are increased in a renal transplant recipient, the dose of immunosuppressive drugs can be reduced. At present, renal transplant recipients are given a regimen of drugs, of which calcineurin inhibitors like tacrolimus are a major constituent. Several studies have found tacrolimus to be nephrotoxic [3]. This has resulted in substitution of tacrolimus, by mTOR (mechanistic Target of rapamycin) inhibitors like sirolimus in many cases. Interestingly, it was also observed that sirolimus increased the levels of regulatory T cells whereas tacrolimus reduced them [4,5]. This effect of sirolimus on regulatory T cell subsets has garnered a lot of interest and is presently a major focus of research.
The main aim of this study was to evaluate the varied effect of calcineurin inhibitors and mTOR inhibitors on Peripheral Blood T cell count in renal transplant recipients. We also intended to find T cell levels in the general population. This study was undertaken since there have been very few similar studies in India and none to our knowledge in Kerala, India.
Materials and Methods
It was a cross-sectional comparative study conducted from 1st March 2016 to 31st August 2017. The study included two groups of renal transplant recipients who came for follow-up to the Nephrology outpatient department at Government Medical College, Kozhikode, Kerala, India. Both groups were exclusively on either tacrolimus or sirolimus based regimen for a minimum period of at least six months. Patients in both groups were also being uniformly administered steroids and mycophenolate mofetil. A third group included in the study consisted of blood donors who came to the Blood Bank. They were taken as controls to ascertain the normal levels of T regulatory cell in the population. Patients who had history of any malignancy, autoimmune disease or those who were positive for HIV, hepatitis C antibody or HBsAg were excluded from the study, since these diseases are likely to interfere with the regulatory T cell levels.
The Institutional Ethics Committee clearance was obtained for this study and the IEC no is GMCKKD/RP 2015/IEC/12, dated 14/12/2015.
2 mL of whole peripheral blood was collected from the antecubital vein in EDTA coated vacutainer tubes under standard aseptic conditions from all subjects after getting informed consent. Flow cytometry was done on the obtained blood sample to assess the levels of regulatory T cells. Immunophenotyping was done using immunophenotypic markers CD4, CD25 and FoxP3 in the 4 colour flow cytometer. All the markers were included in a single tube.
Procedure of flow cytometry and data interpretation: For surface antigen staining, 20 microlitre of antibodies CD4 and CD25 were added to 100 microlitre of blood sample after which the tubes were incubated in the dark. For nuclear antigen staining the cells were first fixed, permeabilized and 20 microlitre of FoxP3 antibody was added after which the tubes were incubated for 30 minutes in the dark. After washing and centrifuging the samples, the cell buttons were re-suspended in 500 microlitre of sheath fluid [6]. It was then run on a pre-calibrated flow cytometer (FACS calibur, BD biosciences).
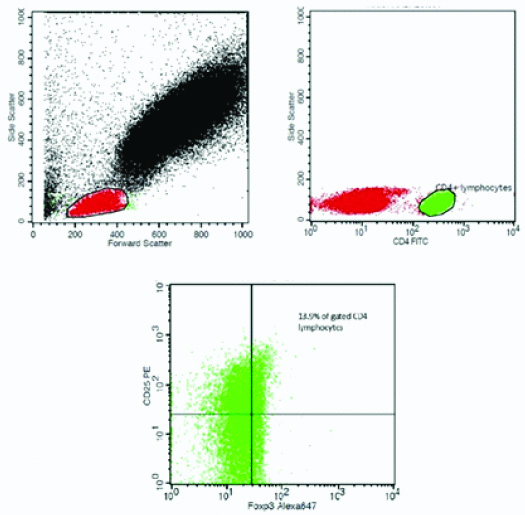
As shown in [Table/Fig-1], the lymphocyte population was gated from the forward scatter/side scatter plots. The CD4 positive lymphocytes were further gated. Quadrants were drawn on the cytogram utilising unstained samples as controls. The percentages of the CD4 lymphocytes that were positive for both CD25 and FoxP3 were taken as regulatory T cells.
An example for the flow cytometry plot showing the gating strategy.
Statistical Analysis
Statistical analysis was done by using SPSS 18.0 software. The quantitative variables were expressed as mean±standard deviation and their statistical significance was analysed using ANOVA test. The p-values <0.05 were considered statistically significant.
Results
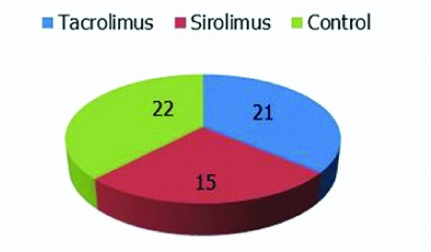
A total of 58 individuals were included in this study. Among them 36 individuals were renal transplant recipients, who were being administered immunosuppressants and 22 individuals were healthy controls [Table/Fig-2].
Pie chart showing the number of cases and controls.
The age of the individuals included in the study sample ranged from 19 years to 57 years. The mean age for tacrolimus and sirolimus based regimens were 36.9±7.9 years and 38.4±10.3 years, respectively. The mean age of the healthy controls was 30.9±8.3 years.
The T regulatory cell count was expressed as percentage and the mean percentage of T regulatory cells among CD4 positive lymphocytes were estimated and compared between the three groups. There was no statistically significant difference between the groups (p-value 0.75). The mean percentage of regulatory T cells in the healthy controls was 11.9% of CD4 lymphocytes [Table/Fig-3].
Mean percentages of tregs among the CD4 lymphocytes.
| Tacrolimus | Sirolimus | Control | p-value |
|---|
| Mean Percentage of Tregs among the CD4 lymphocytes (SD) | 13.1 (7.8) | 13.4 (5.6) | 11.9 (5.4) | 0.75 |
Discussion
Immunosuppressants have many side effects which has forced the scientific community to look into alternative methods for reducing the immune responses in renal transplant recipients. Immune tolerance inhibits the excessive immune reactions against the graft. It means if immune tolerance is increased, patients can tolerate allografts without depending much on maintenance of immunosuppressive drugs. T regulatory cells increases immune tolerance and are known to positively influence the survival of kidney allograft [7].
In recent times, studies have shown the existence of a subgroup of patients who could naturally tolerate their allografts without the use of maintenance immunosuppression [1,8]. Andreola G et al., reported successful acceptance of kidney allografts without maintenance of immunosuppression in a small case series of five patients. Long-term renal allograft acceptance without immunosuppression was achieved in 4 of 5 patients studied [9]. Another case report of long-term survival in a renal transplant recipient without maintenance immunosuppression was reported from China in 2018 [10]. A large scale study conducted by Braza F et al., showed that the percentage of circulating regulatory T cells was higher in tolerant recipients [11]. Similar results have been demonstrated by a number of other studies [12,13].
In the present study the mean percentage of T regulatory cells did not show any statistically significant difference between the patients on tacrolimus and sirolimus. This was not in agreement with the previous studies, which showed that tacrolimus decreased whereas sirolimus increased the levels of regulatory T cells. A study by Segundo DS et al., demonstrated tacrolimus in contrast to sirolimus, reduced the percentages of regulatory T cells [5]. Another study done by Battaglia M, showed that sirolimus selectively expands regulatory T cells [4].
According to previous studies, T regulatory cell count is estimated to be 5-10% of CD4 positive T cells [14]. Very few studies have been done to estimate the Treg cell levels in the Indian population. One pilot study done in India by Sabarish R et al., in seven normal healthy individuals reported the mean percentage of regulatory T cells as 14.75±5.04 [15]. In the present study the mean percentage of regulatory T cells in the healthy controls obtained was 11.9±5.4% of CD4 lymphocytes.
Our study is significant since very few similar studies have been done in India and an extensive literature search did not show any such study done in Kerala. The results observed have not been in agreement with the studies done previously in other parts of the world as we did not find a significant difference in the T regulatory cell levels between the two drug groups. Another interesting observation was that the T regulatory cell levels in the healthy control group were similar to the patient groups.
Limitation
A limitation of our study was the small sample size. The minimum time period between immunosuppressive drug administration and Treg cell level determination was only six months.
Recommendations
Further larger studies with more time interval after immunosuppressive drug administration are needed to confirm, if the observations of the present study are unique to our population.
Conclusion
The present study showed that the regulatory T cell levels were not affected by tacrolimus or sirolimus in renal transplant recipients. The Treg levels in peripheral blood of these patients were comparable to the healthy population.
Author Declaration:
Financial or Other Competing Interests: No
Was Ethics Committee Approval obtained for this study? Yes
Was informed consent obtained from the subjects involved in the study? Yes
For any images presented appropriate consent has been obtained from the subjects. Yes
PLAGIARISM CHECKING METHODS: [Jain H et al.]
Plagiarism X-checker: Jul 02, 2019
Manual Googling: Aug 02, 2019
iThenticate Software: Sep 06, 2019 (9%)
[1]. Orlando G, Hematti P, Stratta RJ, Burke GW, Di Cocco P, Cocco PD, Clinical operational tolerance after renal transplantation: Current status and future challengesAnn Surg 2010 252(6):915-28.10.1097/SLA.0b013e3181f3efb021107102 [Google Scholar] [CrossRef] [PubMed]
[2]. Fan H, Wang J, Zhou X, Liu Z, Zheng SG, Induction of antigen-specific immune tolerance by TGF-β-induced CD4+ Foxp3+ regulatory T cellsInt J Clin Exp Med 2009 2(3):212-20. [Google Scholar]
[3]. Fioretto P, Najafian B, Sutherland Der, Mauer M, Tacrolimus and cyclosporine nephrotoxicity in native kidneys of pancreas transplant recipientsClin J Am Soc Nephrol 2011 6(1):101-06.10.2215/CJN.0385051021051744 [Google Scholar] [CrossRef] [PubMed]
[4]. Battaglia M, Rapamycin selectively expands CD4+CD25+FoxP3+ regulatory T cellsBlood 2005 105(12):4743-48.10.1182/blood-2004-10-393215746082 [Google Scholar] [CrossRef] [PubMed]
[5]. Segundo DS, Ruiz JC, Izquierdo M, Fernández-Fresnedo G, Gómez-Alamillo C, Merino R, Calcineurin Inhibitors, but not rapamycin, reduce percentages of CD4+CD25+FOXP3+ Regulatory T cells in renal transplant recipientsTransplantation 2006 82(4):550-57.10.1097/01.tp.0000229473.95202.5016926600 [Google Scholar] [CrossRef] [PubMed]
[6]. Law JP, Hirschkorn DF, Owen RE, Biswas HH, Norris PJ, Lanteri MC, The importance of Foxp3 antibody and fixation/permeabilization buffer combinations in identifying CD4+CD25+Foxp3+ regulatory T cellsCytom Part J Int Soc Anal Cytol 2009 75(12):1040-50.10.1002/cyto.a.2081519845018 [Google Scholar] [CrossRef] [PubMed]
[7]. Wang Y, Zhang GY, Zheng G, Yi S, Regulatory T cells in kidney disease and transplantationKidney Int 2016 90(3):502-14.10.1016/j.kint.2016.03.02227263492 [Google Scholar] [CrossRef] [PubMed]
[8]. Brouard S, Pallier A, Renaudin K, Foucher Y, Danger R, Devys A, The natural history of clinical operational tolerance after kidney transplantation through twenty-seven casesAm J Transplant Off J Am Soc Transplant Am Soc Transpl Surg 2012 12(12):3296-307.10.1111/j.1600-6143.2012.04249.x22974211 [Google Scholar] [CrossRef] [PubMed]
[9]. Andreola G, Chittenden M, Shaffer J, Cosimi AB, Kawai T, Cotter P, Mechanisms of donor-specific tolerance in recipients of haploidentical combined bone marrow/kidney transplantationAm J Transplant Off J Am Soc Transplant Am Soc Transpl Surg 2011 11(6):1236-47.10.1111/j.1600-6143.2011.03566.x21645255 [Google Scholar] [CrossRef] [PubMed]
[10]. Feng S, Zhuang Y, Liu H, Zhang X, Long-term survival in a recipient of kidney transplant without maintenance immunosuppression: A case reportExp Ther Med 2018 17:360-63.10.3892/etm.2018.6176 [Google Scholar] [CrossRef]
[11]. Braza F, Dugast E, Panov I, Paul C, Vogt K, Pallier A, Central role of CD45RA- Foxp3hi Memory Regulatory T cells in clinical kidney transplantation toleranceJ Am Soc Nephrol JASN 2015 26(8):1795-805.10.1681/ASN.201405048025556168 [Google Scholar] [CrossRef] [PubMed]
[12]. Braudeau C, Racape M, Giral M, Louis S, Moreau A, Berthelot L, Variation in numbers of CD4+CD25highFOXP3+ T cells with normal immuno-regulatory properties in long-term graft outcomeTranspl Int 2007 20(10):845-55.10.1111/j.1432-2277.2007.00537.x17854443 [Google Scholar] [CrossRef] [PubMed]
[13]. Louis S, Braudeau C, Giral M, Dupont A, Moizant F, Robillard N, Contrasting CD25hiCD4+T cells/FOXP3 patterns in chronic rejection and operational drug-free toleranceTransplantation 2006 81(3):398-407.10.1097/01.tp.0000203166.44968.8616477227 [Google Scholar] [CrossRef] [PubMed]
[14]. Sakaguchi S, Wing K, Miyara M, Regulatory T cells–a brief history and perspectiveEur J Immunol 2007 37(S1):116-23.10.1002/eji.20073759317972355 [Google Scholar] [CrossRef] [PubMed]
[15]. Sabarish R, Rao SR, Lavu V, Natural T regulatory cells (n Treg) in the peripheral blood of healthy subjects and subjects with chronic periodontitis- A pilot studyJ Clin Diagn Res: JCDR 2016 10(3):ZC36-ZC39.10.7860/JCDR/2016/15449.744627134998 [Google Scholar] [CrossRef] [PubMed]