Autonomic dysregulation is a common characteristic of a variety of psychiatric disorders, including depression, schizophrenia, and panic disorder [1]. It has been reported that autonomic dysregulation is associated with higher rates of cardiac morbidity and mortality in schizophrenia patients compared to general population [2]. Also, it has been found that antipsychotic drugs affects cognition and behaviour acting via autonomic nervous system, thus they seems to be a trigger factor for autonomic dysregulation. This cardiac autonomic dysfunction can be studied using HRV as a parameter. HRV dysfunction in schizophrenia have been observed in a lot of studies [3,4].
HRV is a measure of autonomic nervous system where it measures variation in the time interval between heartbeats. It is a physiological phenomenon measured by the variation in the “RR interval”. Higher levels of HRV are associated with healthy subjects, that is, they can adapt quickly to physical or psychological environmental changes while lower levels of HRV are associated with subjects with cardiac abnormalities, that is, myocardial infarction, impaired ventricular ejection, and sudden cardiac death [5]. Lower HRV may also cause parasympathetic suppression or sympathetic over-activation indicating maladaptive responses to stressors in the environment [6].
Ketamine if found to be involved in the pathogenesis of schizophrenia in rat animal model probably by alteration of Brain-derived neurotrophic factors [7]. Recent studies suggest that treatment with antipsychotics in schizophrenic patients can lead to alteration of HRV parameters [8,9]. Thus, information on cardiovascular safety and tolerance of antipsychotics is of significant clinical importance as they can promote cardiac arrhythmias and induce sudden cardiac death by altering cardiac autonomic regulation [10]. HRV is a sophisticated and non-invasive tool that can be used to assess autonomic regulation of heart. Thereby, to explore the possible antipsychotic induced changes in cardiac autonomic function, present study was concluded with the aim to compare the effects of olanzapine and aripiprazole on time and frequency domain parameters of HRV in ketamine induced schizophrenic rats.
Materials and Methods
Experimental Animals
This was an observational, prospective study executed in animal house of Government Medical College, Surat, Gujarat, India. Duration of this study was six months. Study started in April 2017 and was completed in September 2017. The experiments were performed on total 36 Male wistar albino rats with a mean body mass of 150-250 gm. Sample size was calculated by power analysis using G-power software tool. Rats were housed in standard transparent polypropylene cages and kept under controlled room temperature and humidity (26-30°C; 40±5%) in a 12-hour light-dark cycle. Animals were acclimatised for one week to laboratory conditions before starting the experiment. The rats were given standard laboratory diet and water ad libitum. Diazepam and Ketamine used in this study were procured from hospital.
Induction of schizophrenia: Schizophrenia was induced by intraperitoneal injection of ketamine (25 mg/kg) for seven days [7].
Experimental design: All experiments were performed after prior permission from the Institutional Animal Ethics Committee (IAEC) and Committee for the Purpose of Control and Supervision on Experiments on Animals (CPCSEA) guidelines, Ministry of Environment and Forests (Animal Welfare Division), Government of India, New Delhi, India. The application subjected regarding ethical review was signed by head of the department, the correspondence number for the same is No./MCS/Pharm/198 (Dated: 20/06/2016).
There were total six groups in the study, 36 rats were allocated randomly into each group. Each group contained six animals. Group 1 received Distilled water 1 mL/kg intraperitoneally for 28 days. Group II to Group VI received 25 mg/kg ketamine intraperitoneally for initial seven days. From day 8th to day 28th daily, Group II received 1 mL/kg distilled water intraperitoneally; Group III and Group IV received 5 mg/kg and 15 mg/kg intraperitoneally olanzapine respectively while Group V and Group VI received 5 mg/kg and 15 mg/kg aripiprazole orally respectively [Table/Fig-1].
Experimental groups receiving different drugs.
| Groups | Drugs | Dose and Duration |
|---|
| Group I | Distilled water | 1 mL/kg intraperitoneally for 28 days. |
| Group II | Ketamine and Distilled water | 25 mg/kg intraperitoneally for 7 days and then from 8th day 1 mL/kg distilled water intraperitoneally for 21 days. |
| Group III | Low dose Olanzapine | 25 mg/kg ketamine intraperitoneally for 7 days and then from 8th day 5 mg/kg intraperitoneally olanzapine for 21 days. |
| Group IV | High dose Olanzapine | 25 mg/kg ketamine intraperitoneally for 7 days and then from 8th day 15 mg/kg intraperitoneally olanzapine for 21 days. |
| Group V | Low dose Aripiprazole | 25 mg/kg ketamine intraperitoneally for 7 days and then from 8th day 5 mg/kg aripiprazole orally for 21 days. |
| Group VI | High dose Aripiprazole | 25 mg/kg ketamine intraperitoneally for 7 days and then from 8th day 15 mg/kg aripiprazole orally for 21 days. |
Estimation of HRV
Twenty-four hours after the last scheduled dose, electrocardiogram was recorded in all the animals. After anaesthetizing each rat with diazepam at a dose of 5 mg/kg, electrodes consisting of 26-gauge needles was placed subcutaneously for 1 cm and was put on all four paws and one on chest; HRV was measured using digital polygraph for five minutes.
Data Analysis
Time Domain Analysis
HRV variables were determined by statistical (parametric) analysis using time domain measures, from the N-N interval data, following measures were derived:
SDNN (standard deviation of N-N intervals), RMSSD (square root of mean square of successive R-R interval difference), NN50 (number of interval differences of successive R-R intervals greater than 50 milliseconds) and pNN50 (the proportion derived by dividing NN50 by total number of R-R intervals). The variance is a measure of total power of spectral analysis. SD of RR intervals signifies both the parasympathetic and sympathetic tone and gives an idea of total variability. The RMSSD and pNN50 are highly correlated with High Frequency, hence signifies the parasympathetic tone.
Frequency Domain Analysis
ECG signal was sampled at frequency of 256 Hz. In a duration of five minutes of the R-wave of QRS complex was detected by using amplitude criteria and R-R intervals were measured. The duration of five minutes was chosen since it is more than period valid for HRV analysis. The Fast Fourier Transformation (FFT) of these R-R intervals verses time plot was carried out at four Hz sampling rate. This gives frequency spectrum of the HRV [11] The frequency range of less than or equal to 0.04 Hz is considered as very low frequency (VLF); 0.04-0.15 Hz as Low Frequency (LF); and 0.15 - 0.40 as High Frequency (HF). The data was obtained from the frequency domain analysis in the conducted study was in terms of LF and HF power, LF/HF. The power of LF is equated with sympathetic and in HF band is with parasympathetic control. The ratio of LF/HF has been considered to be mediated by sympatho-vagal balance. The normalisation of LF (normalised) and HF (normalised) can be calculated as relative ratio of each power component to total power minus VLF.
Statistical Analysis
The quantitative variables are presented as mean±SEM. The statistical analysis was performed using analysis of variance (ANOVA) using SPSS software (version 20) of statistical analysis followed by Tukeys’s post-hoc analysis to compare variables among different groups. A value of p<0.05 was considered significant.
Results
Mean weight of Group I was 230 g, Group II was 225 g, Group III was 220 g, Group IV was 217 g, Group V was 215 g and Group VI was 218 g. [Table/Fig-2] shows HRV variability among the groups.
Estimation of mean values and standard error of HRV items (that is, time domain and frequency domain measures) in different groups.
| HRV Items | Group I (Mean±SD) | Group II (Mean±SD) | Group III (Mean±SD) | Group IV (Mean±SD) | Group V (Mean±SD) | Group VI (Mean±SD) | F-value |
|---|
| MeanHR | 199.59(14.68) | 175.85(25.49) | 195.49(17.22) | 176.55(10.55) | 175.02(9.96) | 167.48(15.34) | 1.10 |
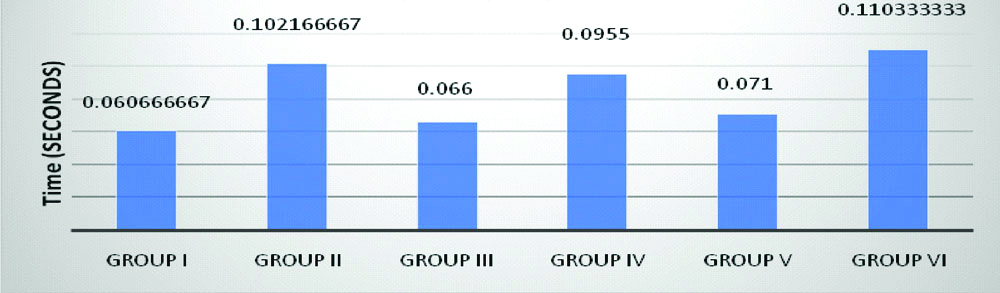
| SDNN | 0.060666667 | 0.10216666 | 0.066 | 0.0955 | 0.071 | 0.110333333 | 0.997 |
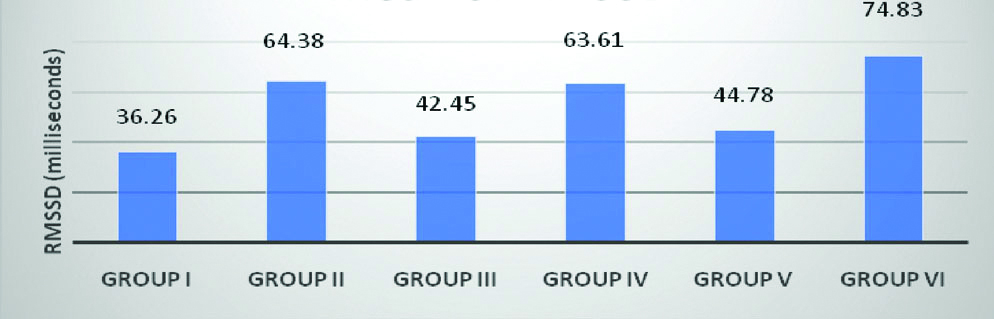
| RMSSD | 36.26(6.37) | 64.38(13.07) | 42.45(10.31) | 63.61(10.84) | 44.78(9.97) | 74.83(25.12) | 1.20 |
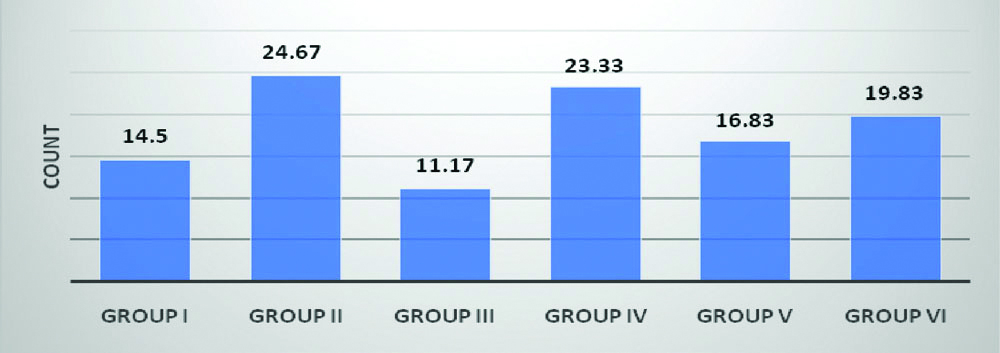
| NN50 | 14.50(9.41) | 24.67(5.32) | 11.17(4.02) | 23.33(4.60) | 16.83(4.65) | 19.83(5.59) | 1.21 |
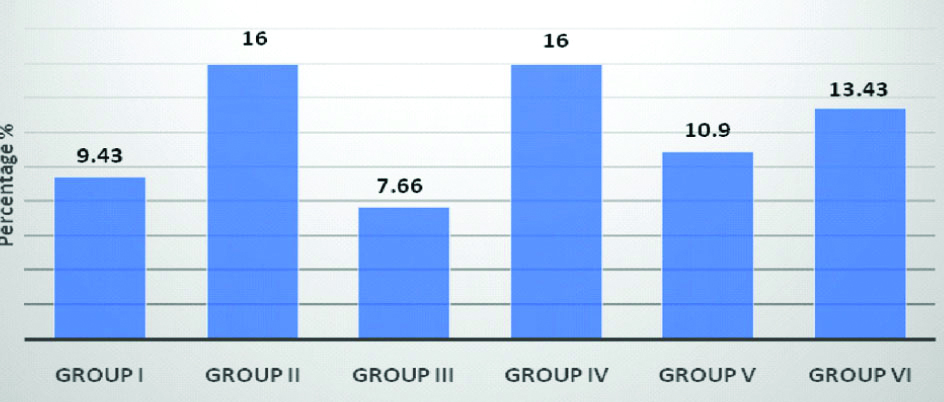
| pNN50 | 9.43(2.36) | 16.00(3.36) | 7.66(2.81) | 16.00(3.27) | 10.90(2.92) | 13.43(3.75) | 1.24 |
| VLF | 5.26(1.96) | 9.11(1.85) | 14.45(6.76) | 9.91(2.42) | 9.96(3.37) | 15.80(6.05) | 0.811 |
| LF | 44.88(5.36) | 43.88(5.30) | 47.25(6.26) | 50.95(2.99) | 48.81(4.80) | 39.38(6.87) | 0.571 |
| HF | 49.85(5.98) | 47.00(5.64) | 38.26(7.50) | 39.15(3.97) | 41.23(3.28) | 44.80(6.23) | 0.669 |
| LF/HF | 1.040(0.25) | 1.100(0.30) | 1.57(0.39) | 1.40(0.21) | 1.24(0.18) | 1.10(0.41) | 0.461 |
HRV: Heart rate variability; HR: Heart rate; SDNN: Standard deviation of N-N intervals; RMSSD: Square root of the mean squared differences of successive normal sinus intervals; NN50: Number of interval differences of successive R-R intervals greater than 50 milliseconds; pNN50: Proportion derived by dividing NN50 by total number of R-R intervals; VLF: Very low frequency; LF: Low frequency; HF: High frequency; One-way ANOVA was conducted with different groups
Standard Deviation of all NN intervals (SDNN)
It reflects all cyclic components responsible for variability in period of recording and is also, an estimate of overall HRV. There was no statistically significant difference between groups as determined by one-way ANOVA {F(5,30)=0.997, p=0.436}. No statistically significant difference was observed on Tukey’s post-hoc analysis in between the groups [Table/Fig-3].
Histogram comparing the mean values of SDNN between groups.
Calculated SDNN: F (5,30)=0.997, p=0.436.
*p<0.05 as compared to Group I #p<0.05 as compared to Group II
Square root of the mean of the sum of the squares of differences between adjacent
NN intervals (RMSSD)
It is an estimate of short-term components of HRV and is essentially the average change in interval between beats [Table/Fig-4]. There was no statistically significant difference between groups as determined by one-way ANOVA {F(5,30)=1.200, p=0.333} [Table/Fig-4].
Histogram comparing the mean values of RMSSD between groups.
Calculated RMSSD:- F(5,30)=1.200, p=0.333
*p<0.05 as compared to Group I #p<0.05 as compared to Group II
Absolute count of differences between successive intervals >50 ms (NN50)
NN50 is the number of interval differences of successive R-R intervals greater than 50 ms. There was no statistically significant difference between groups as determined by one-way ANOVA {F(5,30)=1.218, p=0.325}. No statistically significant difference was observed on Tukey’s post-hoc analysis in between the groups [Table/Fig-5].
Histogram comparing the mean values of NN50 between groups.
Calculated NN50:- F(5,30)=1.218, p=0.325
*p<0.05 as compared to Group I #p<0.05 as compared to Group II
Proportion of differences >50 ms (pNN50)
pNN50 is the proportion of differences >50 ms, derived by dividing NN50 by total number of R-R intervals. There was no statistically significant difference between groups as determined by one-way ANOVA {F(5,30)=1.243, p=0.314}. No statistically significant difference was observed on Tukey’s post-hoc analysis in between the groups [Table/Fig-6].
Histogram comparing the mean values of pNN50 between groups.
Calculated pNN50:- F (5,30)=1.243, p=0.314
*p<0.05 as compared to Group I #p<0.05 as compared to Group II
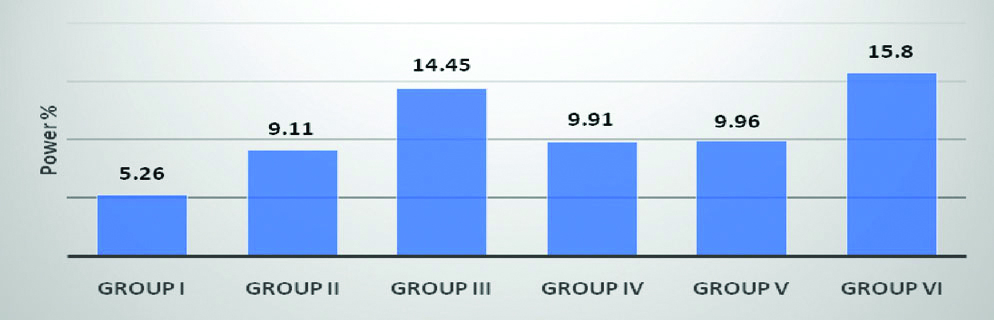
Very Low Frequency (VLF)
Power in LF range is 0.0033 to 0.04 Hz and accounts for 12% of total power. It represents fluctuations in R-R intervals that have a period between 20 seconds and 5 minutes. There was no statistically significant difference between groups as determined by one-way ANOVA {F(5,30)=0.811, p=0.551}. No statistically significant difference was observed on Tukey’s post-hoc analysis in between the groups [Table/Fig-7].
Histogram comparing the mean values of power of very low frequency (VLF) between groups.
Calculated VLF:- F (5,30) =0.811, p=0.551
*p<0.05 as compared to Group I #p<0.05 as compared to Group II
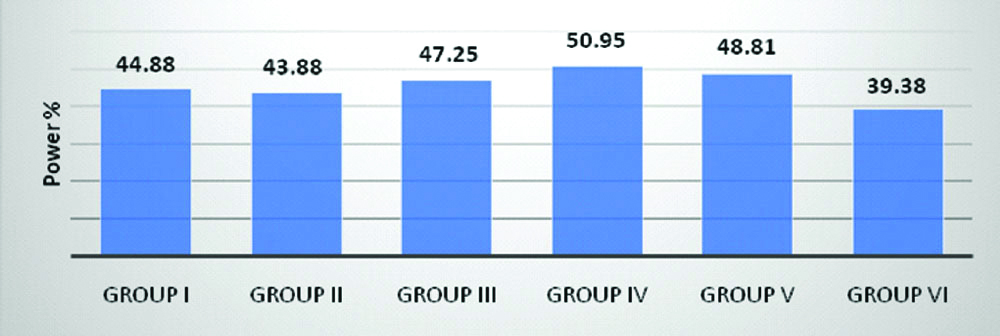
Low Frequency (LF)
Power in LF range is 0.04-0.15 Hz. LF component corresponds to both parasympathetic and sympathetic branches of autonomic nervous system, but mainly reflects sympathetic activity. There was no statistically significant difference between groups as determined by one-way ANOVA {F(5,30)=0.571, p=0.722}. No statistically significant difference was observed on Tukey’s post hoc analysis in between the groups [Table/Fig-8].
Histogram comparing the mean values of power of LF between groups.
Calculated LF: - F (5,30) =0.571, p=0.722
*p<0.05 as compared to Group I #p<0.05 as compared to Group II
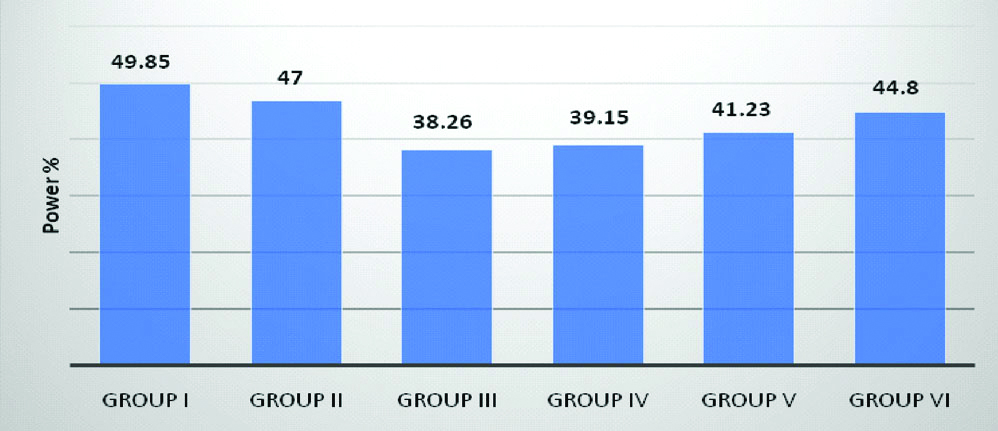
High Frequency (HF)
Power in LF range is 0.15-0.4 Hz. HF component corresponds to the parasympathetic branch of autonomic nervous system. There was no statistically significant difference between groups as determined by one-way ANOVA {F(5,30)=0.669, p=0.650}. No statistically significant difference was observed on Tukey’s post-hoc analysis in between the groups [Table/Fig-9].
Histogram comparing the mean values of power of high frequency (HF) between groups.
Calculated HF:- F(5,30)=0.669, p=0.650
*p<0.05 as compared to Group I #p<0.05 as compared to Group II
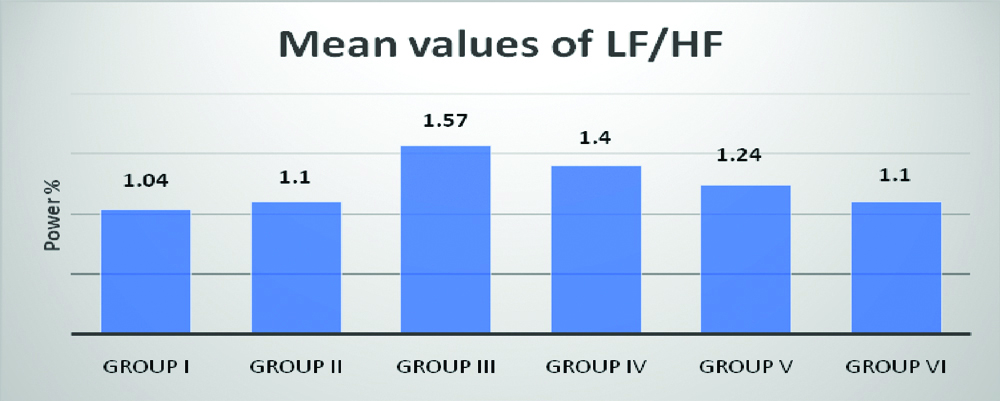
Ratio of Low Frequency to High Frequency (LF/HF)
Ratio of LF/HF measure of ANS balance. There was no statistically significant difference between groups as determined by one-way ANOVA {F (5,30)=0.461, p=0.802}.
No statistically significant difference was observed on Tukey’s post-hoc analysis in between the groups [Table/Fig-10].
Histogram comparing the mean values of power of ratio of low frequency to high frequency (LF/HF) between groups.
Calculated LF/HF: - F (5,30) =0.461, p=0.802
*p<0.05 as compared to Group I #p<0.05 as compared to Group II
Discussion
Schizophrenic patients experience higher rates of cardiovascular mortality and morbidity as compared to general population [12]. Typical antipsychotic drugs have been found to be associated with increased risk of serious ventricular arrhythmias and sudden cardiac death in many patients [13,14], but not enough data is available to demonstrate cardiovascular safety of atypical antipsychotic drugs.. HRV analysis can be used to assess cardiovascular safety and tolerance of atypical antipsychotics in experimental animal models [15].
Results of this study showed that there was no significant difference in the mean values of RR interval in olanzapine and aripiprazole treated group as well as control group at all given doses. With both high (15 mg/kg) and low dose (5 mg/kg) of olanzapine and aripiprazole, no significant difference was found in time domain as well as frequency domain parameters of HRV as compared to control group (group I).
Standard deviation of N-N intervals (SDNN) was increased more in high dose (15 mg/kg) olanzapine and aripiprazole treated groups as compared to low dose (5 mg/kg) olanzapine and aripiprazole treated groups. But, no significant difference could be seen in the mean values of SDNN between the groups (p=0.436). Valkonen-Korhonen M et al., reported that schizophrenic patients exhibited a significantly lower SDNN than healthy controls. In this study, no such result was obtained as ketamine treated group showed increased SDNN as compared to distilled water treated group, but the changes were not significant [15]. Wang J et al., reported that patients after 4 weeks of olanzapine treatment showed reductions of SDNN [16].
RMSSD dysfunction is seen in schizophrenia and is characterised by dysfunctional parasympathetic activity. Extremely low RMSSD signifies true autonomic dysfunction. RMSSD decreased more in low dose (5 mg/kg) olanzapine and aripiprazole treated groups as compared to high dose (15 mg/kg) olanzapine and aripiprazole treated groups. But, no significant difference could be seen in the mean values of RMSSD in between the groups (p=0.333). Malaspina D et al., and Valkonen-Korhonen M et al., reported that unmedicated schizophrenic patients exhibited decreased RMSSD compared to normal subjects suggesting that this disorder is characterised by a decrease in parasympathetic activity independent of medication effects [15,17].
NN50 was increased in high dose olanzapine and aripiprazole treated groups as compared to low dose olanzapine and aripiprazole treated groups. But, no significant difference could be seen in the mean values of NN50 between the groups (p=0.325).
pNN50 was increased in high dose olanzapine and aripiprazole treated groups as compared to low dose olanzapine and aripiprazole treated groups. But, no significant difference could be seen in the mean values of pNN50 between the groups (p=0.314). Malaspina et al., and Valkonen-Korhonen M et al., reported that unmedicated schizophrenic patients exhibited decreased pNN50 as compared to normal comparison subjects suggesting that this disorder is characterised by a decrease in parasympathetic activity independent of medication effects [15,17].
LF component corresponds to both parasympathetic and sympathetic branches of autonomic nervous system, but mainly reflects sympathetic activity. Increased LF suggests increased sympathetic cardiac functioning. Value of LF were almost similar in all the groups. No significant change could be seen in the mean values of LF between the groups (p=0.722). Hempel RJ et al., found that olanzapine treated patients showed the highest power in the low-frequency range of heart rate suggesting an increased sympathetic cardiac functioning [18]. Wang J et al., reported that patients after four weeks of olanzapine treatment showed increase in LF [16].
HF component corresponds to the parasympathetic branch of autonomic nervous system. Reduced HF signifies decreased cardiac vagal control. As values of HF was decreased more in olanzapine treated groups as compared to aripiprazole treated groups, this data suggests that dysfunctional parasympathetic functioning is observed more with use of olanzapine as compared to aripiprazole. But, statistically there was no significant difference observed in the mean values of HF between the groups (p=0.650). Valkonen-Korhonen M et al., reported that schizophrenic patients exhibited a significantly lower HF power than healthy controls [15]. In one study involving analysis of HRV in schizophrenic patients switched from typical antipsychotic agents to amisulpride and olanzapine, Wang Y-C et al., found that there were no significant increase in the mean, variance and HF of RR intervals in olanzapine group [19]. In another study investigating the difference in effects of Quetiapine, Olanzapine, Aripiprazole and Risperidone on autonomic nervous activity in Japanese patients, it was found that Quetiapine showed significantly diminished autonomic activity as compared to the other drugs. Thus, it was observed that both aripiprazole and olanzapine had significantly lesser effect on ANS activity as compared to Quetiapine [20].
VLF reflect the influence of several physiological mechanisms, including the renin-angiotensin system, vasomotor tone, and physical activity, sleep-disordered breathing, thermoregulation on heart beats. VLF was increased in low dose olanzapine and high dose aripiprazole treated groups as compared to high dose olanzapine and low dose aripiprazole treated groups. But, no significant difference could be seen in the mean values of VLF between the groups (p=0.551).
LF/HF ratio is an indicator of cardiac autonomic balance. If this ratio is increased, it signifies that there is an imbalance between cardiac autonomic activity. This ratio was increased in treatment received groups as compared to healthy rats of Group I. Low dose olanzapine and aripiprazole treated group had high LF/HF ratio as compared to high dose olanzapine and aripiprazole treated group respectively. However, no significant difference could be seen in the mean values of LF/HF between the groups. (p=0.802). In one study involving acutely ill schizophrenic patients after giving six weeks of treatment, it was found that there was significant increase in the mean RR interval and a significant decrease in LF/HF ratio [15]. Mueck-Weymann M et al., found that LF/HF ratios of the healthy controls and olanzapine treated patients were similar suggesting that even during olanzapine treatment autonomic cardiac changes remains relatively unchanged [21]. Wang J et al., reported that patients after four weeks of olanzapine treatment showed increased LF/HF ratio [16].
So, in the present study, there was no significant deviation found in all the parameters of HRV in all the six groups i.e., distilled water treated group (control), ketamine treated group, low and high doses of olanzapine and aripiprazole treated group respectively. This data suggests that the sympathetic and parasympathetic modulation of HRV remains unchanged even during olanzapine and aripiprazole treatment.
Limitation
In this study, all the drug treatments in every group were administered intraperitoneally but in Group V and Group VI aripiprazole was given orally as it was only available in forms of tablet. Diazepam itself causes increase in total power of HRV in both young and elderly individuals [22]. Effect of diazepam used for anaesthetizing rats in this study was not evaluated. Though in one study it has been established that ketamine 25 mg/kg given intraperitoneally daily for seven days, alters behaviour and decreases brain derived neurotrophic factor [7], in this study we have not evaluated if schizophrenia was induced in albino rats.
Conclusion
Results of this study suggest that both aripiprazole and olanzapine at high (15 mg/kg) and low (5 mg/kg) doses can be considered comparable to placebo in terms of their impact on HRV. Thus, in the light of review of previous research work and results obtained from the present study, olanzapine and aripiprazole seems to be safer drugs in terms of lowering HRV and causing adverse cardiovascular events.
HRV: Heart rate variability; HR: Heart rate; SDNN: Standard deviation of N-N intervals; RMSSD: Square root of the mean squared differences of successive normal sinus intervals; NN50: Number of interval differences of successive R-R intervals greater than 50 milliseconds; pNN50: Proportion derived by dividing NN50 by total number of R-R intervals; VLF: Very low frequency; LF: Low frequency; HF: High frequency; One-way ANOVA was conducted with different groups