OSCC is the most common form of carcinoma of the oral cavity. It is the sixth most common cancer worldwide and the most common in the Indian subcontinent [1]. Regardless of the various breakthroughs achieved in its treatment, the morbidity and mortality rates have not improved in the past three decades. A wide spectrum of genetic, epigenetic, environmental and immune related risk factors are implicated in the evolution of OSCC and salivary gland carcinomas, of which tobacco and betel quid chewing are the most common [2]. Histopathological examination is a gold standard and the most formidable weapon in the armamentarium of a pathologist while dealing with a case of OSCC. Regardless of how, there is always an individual variation in using the conventional histopathological grading and predicting the biological behaviour of the tumour is not always possible. This has led to implementation of qualitative and quantitative analysis of cellular as well as nuclear proliferative markers by histochemical and immuno-histochemical techniques [3]. This study utilised the Anneroth’s multifactorial grading system of SCC and compared the histological grading with nuclear proliferative indices of AgNOR and p53. The rationale behind the present study was to analyse the effectiveness of nuclear proliferative markers in comparison to the Anneroth grade of OSCC. Hence, in the present study, our alternative hypothesis was that the histopathological grade of OSCC should correlate with nuclear proliferative indices such as AgNORs and p53.
The aim of the present study was to analyse the relationship between the histomorphological grading (Anneroth’s grading) and the nuclear proliferative markers that is AgNORs and p53 protein in OSCC.
The present study was conducted with the objectives of diagnosing and confirming OSCC on histopathological examination, grading the OSCCs by the Anneroth multifactorial grading system of SCC, evaluating the histochemical and immunohistochemical profile of OSCCs by using AgNORs and p53 as proliferative markers and understanding the correlation between them and the histological grade of OSCCs.
Materials and Methods
This cross-sectional study was carried out for a span of two years (July 2017 to July 19). It was conducted in sections of histopathology and immuno-histochemistry of Department of General Pathology, Jawaharlal Nehru Medical College (JNMC) and Department of Oral Pathology, Sharad Pawar Dental College (SPDC) in coordination with Departments of General Surgery and Otorhinolaryngology (ENT), Acharya Vinobha Bhave Rural Hospital (AVBRH) and Department of Oral and Maxillofacial Surgery, SPDC. The study was approved by the institutional ethics committee {DMIMS (DU)/IEC/2016-17/4048} and informed consent was taken from the patients participating in the study.
A total of 98 cases of OSCC were evaluated in the present study. The sample size of 98 was calculated by using the following formula:
n=(Z a/2)2 × p × (1-p)/d2 where,
“Z a/2” is the level of significance at 5% that is 95% confidence interval.
“p” is the prevalence of OSCC.
“d” is the desired error of margin.
“n” is the sample size.
Inclusion Criteria
All cases diagnosed as SCC of the oral cavity.
All de novo cases of OSCC were included in the study.
Exclusion Criteria
All cases of malignancy other than SCC.
Cases of non-neoplastic lesions of the oral cavity.
Cases with recurrence.
Cases with previous history of chaemotherapy and radiotherapy were excluded from the study.
Method of Determining the Histological Grade of OSCC
All Haematoxylin and Eosin (H&E) stained sections of tumour mass were screened and the section with sufficient amount of tumour mass was selected for determining the histological grade, the AgNOR score and the p53 expression. The slides stained with H&E were reviewed by a senior oral pathologist for Anneroth’s grading. The AgNOR and p53 stained slides were reviewed by a senior pathologist. All sections were reviewed by only one person to avoid inter-observer subjective bias.
The histological grade of the tumour was determined by employing the Anneroth’s multifactorial grading system for SCC. It is highly elaborative and provides an extra edge to the pathologist by evaluating the tumour-host relationship with the help of parameters like lymphoplasmacytic infiltration and pattern and stage of invasion. Both the reviewers were blind to each other’s results. Various parameters like degree of keratinization, number of mitosis per high power field, nuclear pleomorphism, stage of invasion, pattern of invasion and lymphoplasmacytic infiltration were evaluated and scores from 1 to 4 were given to calculate the grade of the tumour. The grades of the tumour were allotted as follows: Grade I: score 6-12; Grade II: score 13-18 and Grade III: score 19-24 [Table/Fig-1] [4].
Anneroth’s multifactorial grading system for SCC [4].
| Morphological parameter | 1 | 2 | 3 | 4 |
|---|
| Extent of Keratinization | High keratinization (>50% of cells) | Moderate keratinization (20-50% of cells) | Minimal Keratinization (5-20% of cells) | No keratinization (0-5% of cells) |
| Pleomorphism in nuclei | Mild (>75% mature cells) | Moderately abundant (50-75% mature cells) | Abundant pleomorphism (25-50% mature cells) | Extreme nuclear polymorphism (0-25% mature cells) |
| No. of mitosis per HPF | 0-1 | 2-3 | 4-5 | >5 |
| Invasion pattern | Borders are pushing, infiltrating and well delineated | Invasion in the form of strands, bands and infiltrating solid cords | Infiltrating cells in the form of tiny cords and groups (n>15) | Marked and wide spread distribution of small groups of cells. |
| Invasion stage | Carcinoma In situ | Presence of distinct invasion in lamina propria | Deeper invasion of lamina propria and adjoining structures | Extensive deep invasion replacing normal stromal tissues |
| Lymphoplasmacytic Infiltration | Marked | Moderate | Slight | None |
Method of Determining the Mean AgNOR Count
The AgNOR score of the tumour was assessed by examining 100 nuclei and calculating the mean AgNOR score per nucleus under oil immersion lens. The one step silver colloid technique recommended by Ploton D et al., was utilised for demonstrating AgNORs [5].
Method of Determining the p53 Expression
Immuno-histochemical expression of p53 protein (Clone DO-7. Brand: DAKO™, Glostrup, Denmark) was evaluated by subjecting the sections to immuno-histochemistry. The cases were given scores as 0, 1, 2 and 3 depending upon the percent of tumour cells exhibiting positive nuclear staining for mutant p53 protein. Total 1000 cells were counted. The scores given for p53 expression are as follows:
Score 0: <25% p53 positive cells.
Score 1: 25-50% p53 positive cells.
Score 2: 50-75% p53 positive cells.
Score 3: >75% p53 positive cells [6].
Statistical Analysis
The data collected was tabulated in a master chart and calculations were done accordingly. Statistical analysis was done by descriptive and inferential statistics using chi-square test, student’s unpaired t-test, regression analysis, One-Way Analysis of Variance (ANOVA) (F-value) and multiple comparison: Tukey Test. Software used in the analysis was SPSS 22.0 version, GraphPad Prism 6.0 version and EPI-INFO 6.0 version and p<0.05 was considered as level of significance (S).
Results
Observations
Total 98 cases were evaluated in the present study. Of these, 69 cases (70.41%) were males and 29 cases (29.59%) were females. The male to female ratio in the study was 2.37:1. Total 37 patients (37.76%) were in the age group of 51-60 years, followed by 34 cases (34.69%) in the age group of 41-50 years, 15 cases (15.31%) in the age group of 61-70 years, 11 cases (11.22%) in the age group of 31-40 years and one case (1.02%) in the 71-80 years age group. Considering the site of malignancy, the major chunk of the cases was taken up by buccal mucosa which was 39 cases (39.80%) followed by 32 cases involving the gingivo-buccal sulcus (32.65%) followed by 15 cases involving the tongue (15.31%) and 12 cases involving the alveolus (12.24%).
Results
Statistically significant differences were observed in the mean AgNOR counts between grades I and II, grades II and III and grades I and III OSCC. An increasing trend in the mean AgNOR count and p53 expression was observed with progressing histological grade of OSCC [Table/Fig-2].
Comparison between the Anneroth histological grade and the mean AgNOR count of the tumour (one-way ANOVA).
| Anneroth grading | No. of patients | Mean AgNOR count (per nucleus) | SD |
|---|
| Anneroth Grade I | 32 (32.65%) | 1.75 | 0.29 |
| Anneroth Grade II | 36 (36.73%) | 2.60 | 0.48 |
| Anneroth Grade III | 30 (30.62%) | 4.25 | 0.33 |
| F-value | 329.43, p-value=0.0001,S |
*p=0.0001, significant
In the present study, p53 negativity was observed in majority cases of Anneroth grade I OSCC. However, some cases which had p53 expression more than 75% (score 3) were also present in this category. This implies that even though the tumour is of low grade, cases of OSCC with high p53 immuno-expression should be followed-up on a regular basis [Table/Fig-3].
Correlation between the Anneroth histological grade and the p53 immunoexpression of the tumour (one-way ANOVA).
| Anneroth grading | No. of patients | Mean p53 score (% of cells stained) | SD |
|---|
| Anneroth Grade I | 32 (32.65%) | 29.21 | 23.85 |
| Anneroth Grade II | 36 (36.73%) | 46.22 | 32.37 |
| Anneroth Grade III | 30 (30.62%) | 70.53 | 28.46 |
| F-value | 16.25, p-value=0.0001, S |
*p=0.0001, significant
An increasing trend in the mean AgNOR count and p53 expression was observed with progressing histological grade of OSCC [Table/Fig-4].
Comparison between the Anneroth histological grade of OSCC and the proliferative markers AgNORs and p53.
| Anneroth’s histological grade | Mean AgNOR score (±SD) | Mean p53 expression (±SD) |
|---|
| Anneroth Grade I | 1.75±0.29 | 29.21±23.85 |
| Anneroth Grade II | 2.60±0.48 | 46.22±32.37 |
| Anneroth Grade III | 4.25±0.33 | 70.53±28.46 |
Discussion
The present study made an attempt to evaluate the relationship between the histological grade (Anneroth grade) and the proliferative markers (AgNORs and p53) in OSCCs. It also assessed how efficient adjuncts these biomarkers could prove to be in the gold standard method of histological grading. The clinical significance of the present study lies in the fact that proliferative markers like AgNOR and p53 coupled with the histological grade and other clinico-pathological parameters can aid the surgeon and the histopathologist to predict the biological behaviour of the tumour and thus facilitate effective therapeutic regimens.
NORs are the indicators of transcriptional activity of DNA and can be visualised by staining with silver nitrate under prescribed guidelines; the structures thus demonstrated are termed AgNORs. AgNORs appear as intra-nuclear, black to brownish black dots, against a pale yellow to golden yellow background. The above findings suggest that as the metabolic and morphological characters of malignant cells progressively get altered, the chromosomal and the AgNOR distribution gets disorganised culminating in the formation of small, multiple and dispersed nucleoli which reflects increase in the number of AgNORs with increasing malignancy grade and that impaired cell cycle and defective nucleolar association are accountable for increased AgNOR counts in progressing grades of OSCC. The protein synthesis is abnormally elevated in malignant cells and this is responsible for increased AgNOR counts.
The evaluation of the NOR count renders precious help in predicting tumour aggressiveness and for investigating the rate of cellular proliferation. Their numbers are inclined to be larger and irregular in malignant lesions than those of the normal tissues [7]. Similar findings were observed in studies conducted by Manu V et al., Chauhan S et al., Hanemann JA et al., Sharma R et al., Gulia SP et al., as well as the present study [Table/Fig-5,6,7,8,9,10 and 11] [7-11]. The simplicity, cost effectiveness, ease of use and good correlation with other markers make them a good supplementary adjunct to the routine histopathological examination.
Correlation between mean AgNOR counts and histological grade in different studies and their comparison with the present study.
| Author | Histological grade of tumour and mean AgNOR count. (Mean±SD) | p-value |
|---|
| Grade I (well differentiated) | Grade II (moderately differentiated) | Grade III (poorly differentiated) |
|---|
| Manu V et al., [7] | 3.296±0.631 | 4.29±0.789 | 5.21±0.16 | p<0.05 |
| Chauhan S et al., [8] | 2.36 | 3.72 | 5.83 | -- |
| Hanemann JA et al., [9] | 3.20±0.61 | 5.33±1.42 | 8.27±0.39 | p<0.05 |
| Sharma R et al., [10] | 3.305±0.11 | 5.324±0.43 | 8.167±0.22 | p<0.001 |
| Gulia SP et al., [11] | 4.71±0.81 | 6.34±0.89 | 8.70±0.65 | p<0.05 |
| Present study | 1.75±0.29 | 2.60±0.48 | 4.25±0.33 | p=0.0001 |
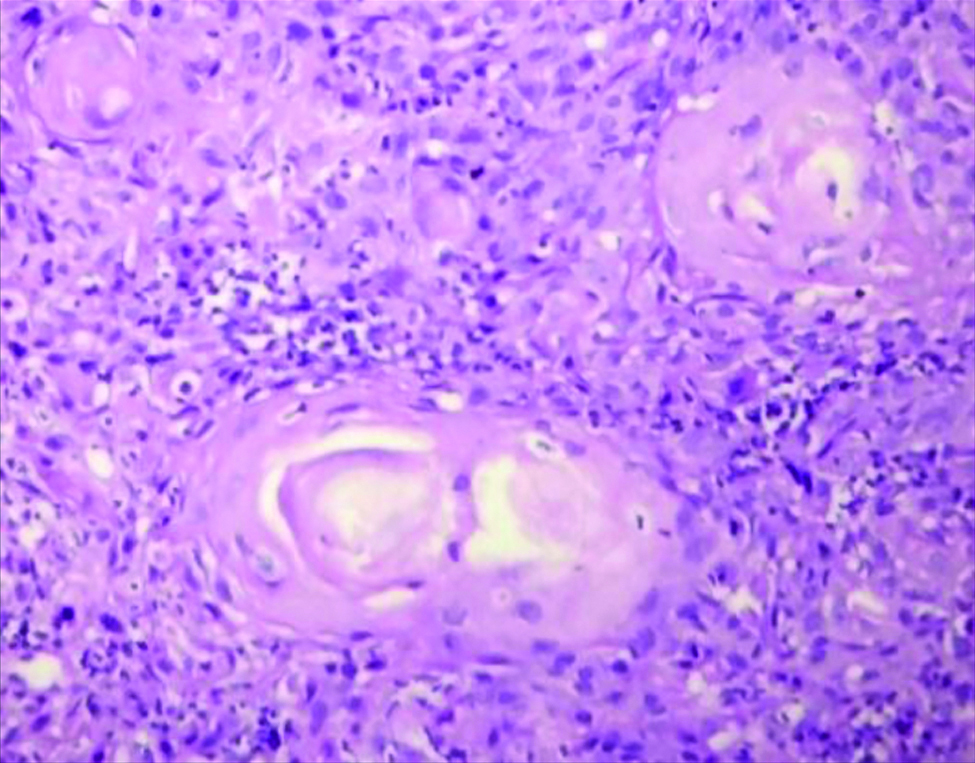
Section stained with Haematoxylin and Eosin stain (high power view: 40x) showing histopathological features suggestive of OSCC, Anneroth grade I.
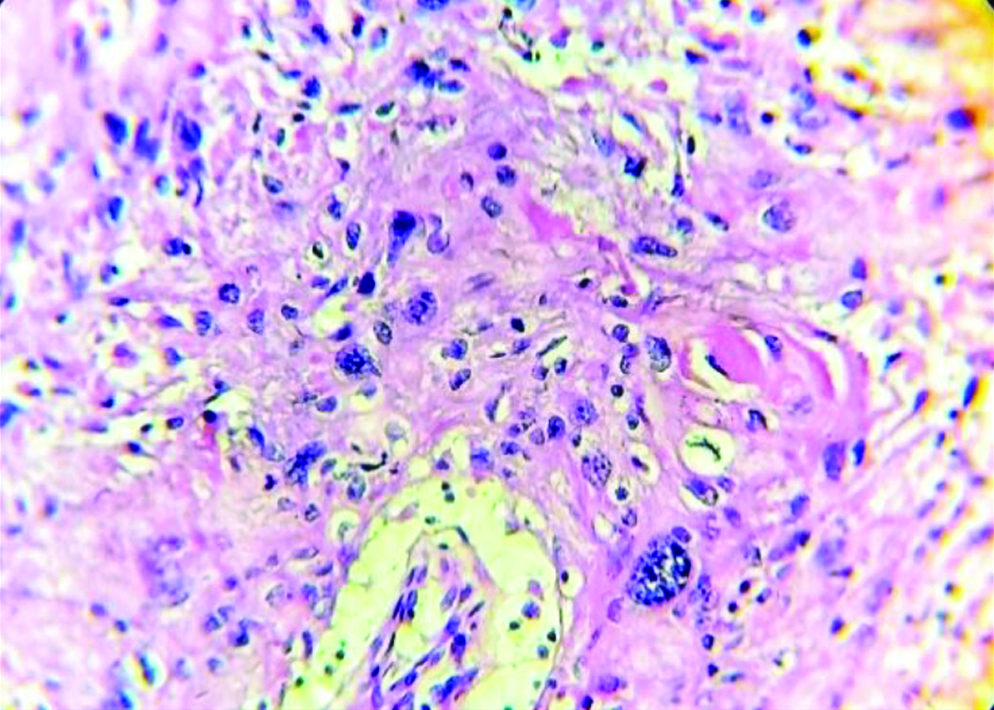
Section stained with haematoxylin and eosin stain (high power view: 40x) showing histopathological features suggestive of OSCC, anneroth grade II.
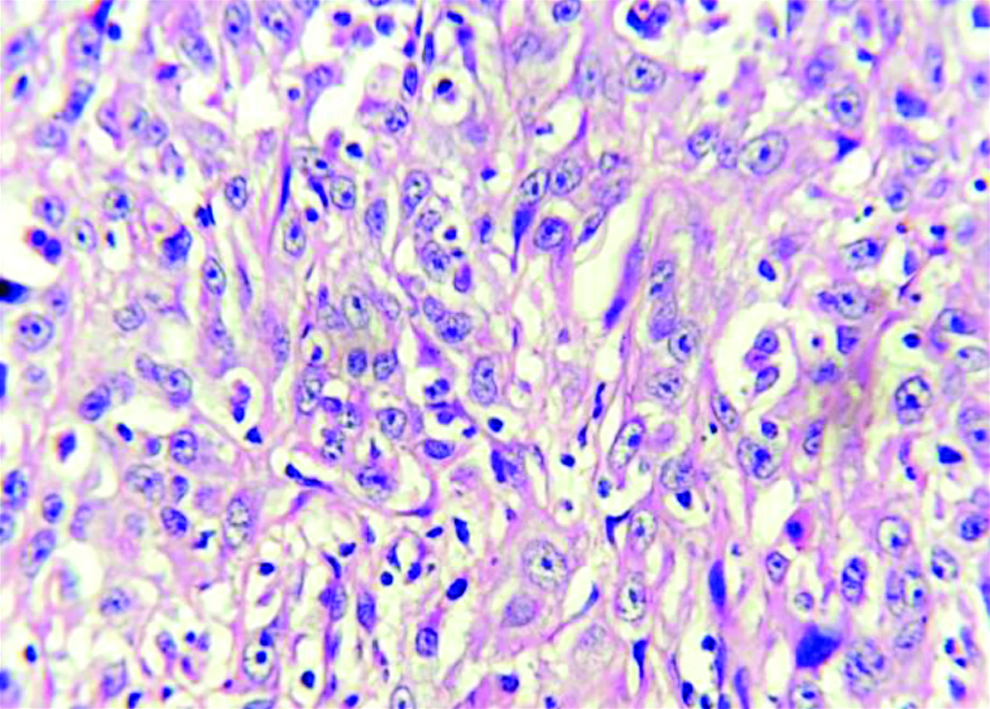
Section stained with haematoxylin and eosin stain (high power view: 40x) showing histopathological features suggestive of OSCC, anneroth grade III.
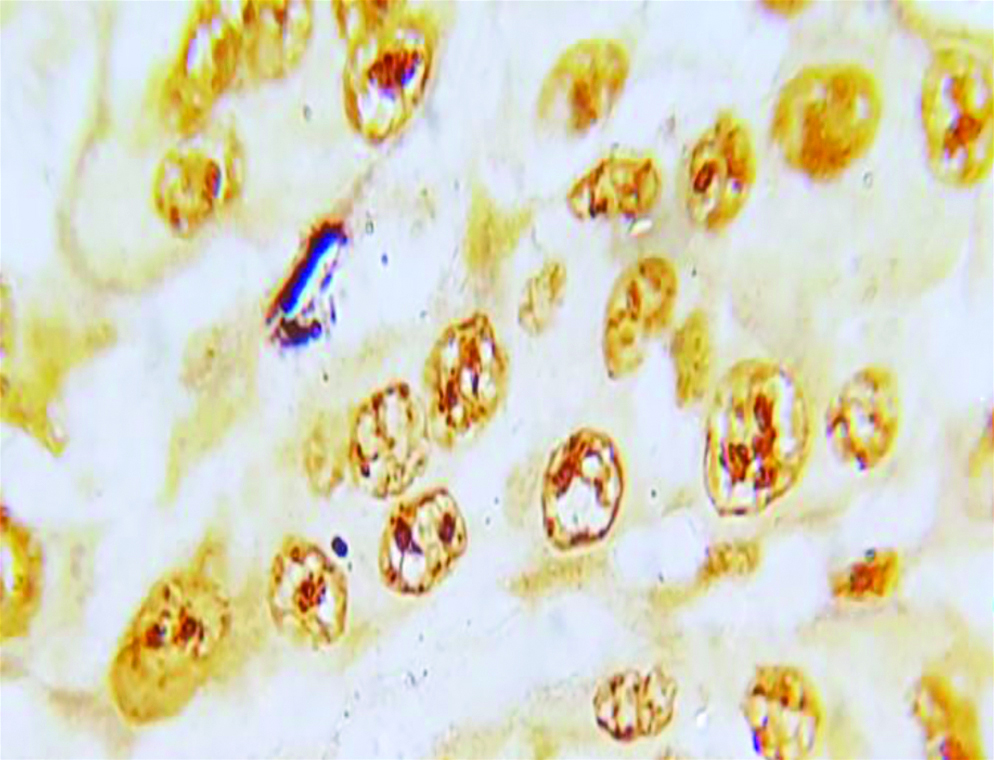
Section of anneroth grade I OSCC stained with special histochemical stain (silver nitrate stain, oil immersion view: 100X) showing malignant squamous cells with 1-2 AgNORs per nucleus.
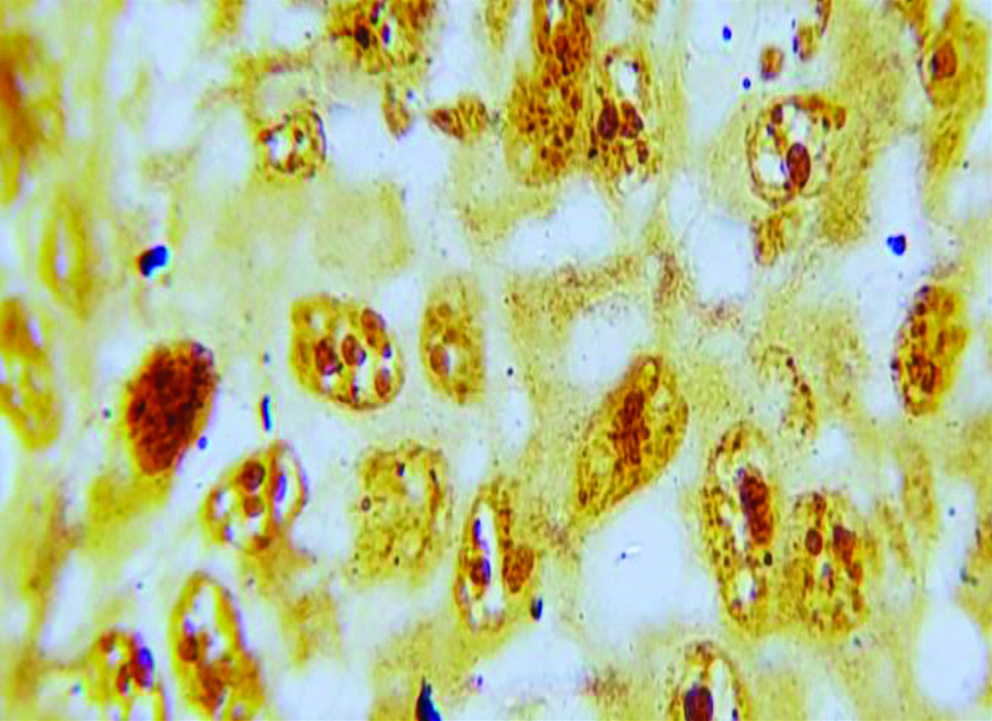
Section of anneroth grade II OSCC stained with special histochemical stain (silver nitrate stain, oil immersion view: 100X) showing malignant squamous cells with 3-4 AgNORs per nucleus.
Section of anneroth grade III OSCC stained with special histochemical stain (silver nitrate stain, oil immersion view: 100x) showing malignant squamous cells with 4-5 AgNORs per nucleus.
The p53 gene located on chromosome 17 (17p13.1) is widely known as “the molecular policeman” and also as “guardian of the genome”. It is a Tumour Suppressor Gene (TSG) encoding a 53 kD protein which is responsible for arresting the cell cycle at the late G1 phase in cells with DNA damage. The cell cycle is arrested till the damage is repaired. If the damage is beyond repair, p53 will induce apoptosis in that particular cell thus, preventing the emergence of cell clones with severe DNA damage. Point mutations in the p53 gene will lead to uncontrolled proliferation of cells with DNA damage, ultimately culminating in malignant transformation [6].
The above findings imply that defective p53 due to reduced degradation accumulates inside the nucleus and its immuno-expression is directly related to decreased differentiation of the tumour. Mutated p53 due to its structural changes and increased stability has increased half-life and defective degradation facilitates its nuclear accumulation [6]. Similar findings were observed in the studies conducted by Kaur J et al., Kaur J et al., and Pandya JA et al., as well as in the present study [Table/Fig-12,13,14,15 and 16] [12-14]. Cells with inactivated p53 lose their ability to damage DNA repair and induce cell cycle arrest leading to abnormal proliferation and pleomorphism; more the degree of pleomorphism, greater the p53 expression.
Correlation between mean p53 expression and histological grade of OSCC in different studies and their comparison with the present study.
| Name of the study | Histological grade of tumour and mean p53 expression (%) (Mean±SD) | p-value |
|---|
| Grade I (well differentiated) | Grade II (moderately differentiated) | Grade III (poorly differentiated) |
|---|
| Kaur J et al., [12] | 20 | 72 | 88 | p=0.004 |
| Kaur J et al., [13] | 14 | 78 | 100 | p<0.001 |
| Pandya JA et al., [14] | 42.625 | 48.888 | 70.285 | p<0.001 |
| Present study | 29.21±23.85 | 46.22±32.37 | 70.53±28.46 | p=0.0001 |
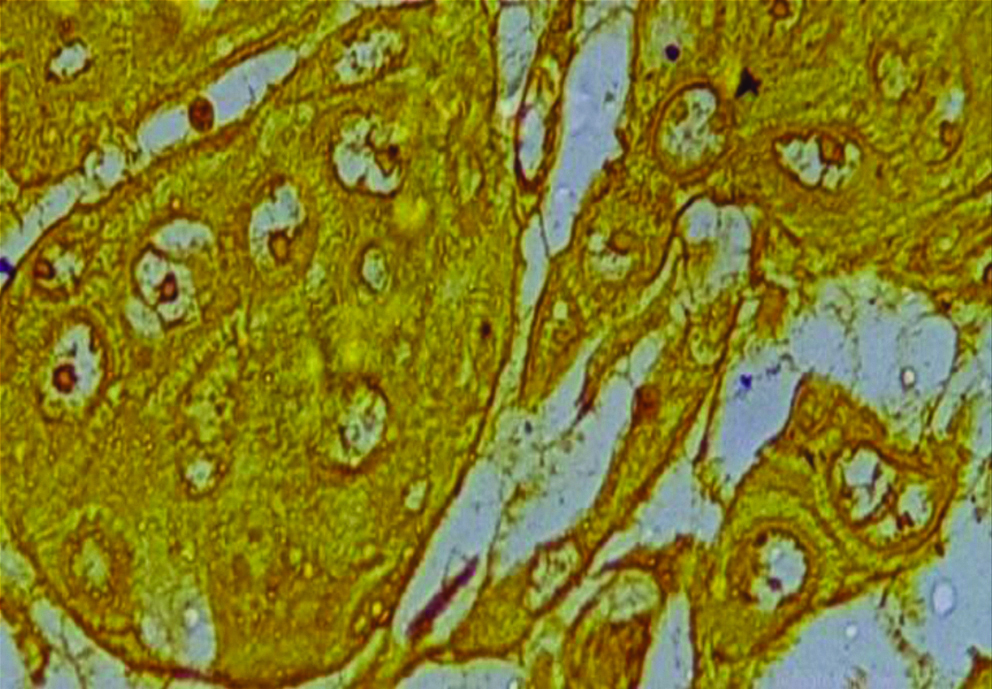
Section stained with immunohistochemical stain (p53) (high power view: 40x) showing score 0 p53 expression (immuno-expression less than 25%). P53 stains the nuclei of the malignant squamous cells.

Section stained with immuno-histochemical stain (p53) (high power view: 40x) showing score 1 p53 expression (immuno-expression between 25-50%). Brown coloured nuclear staining for p53 is clearly visible.

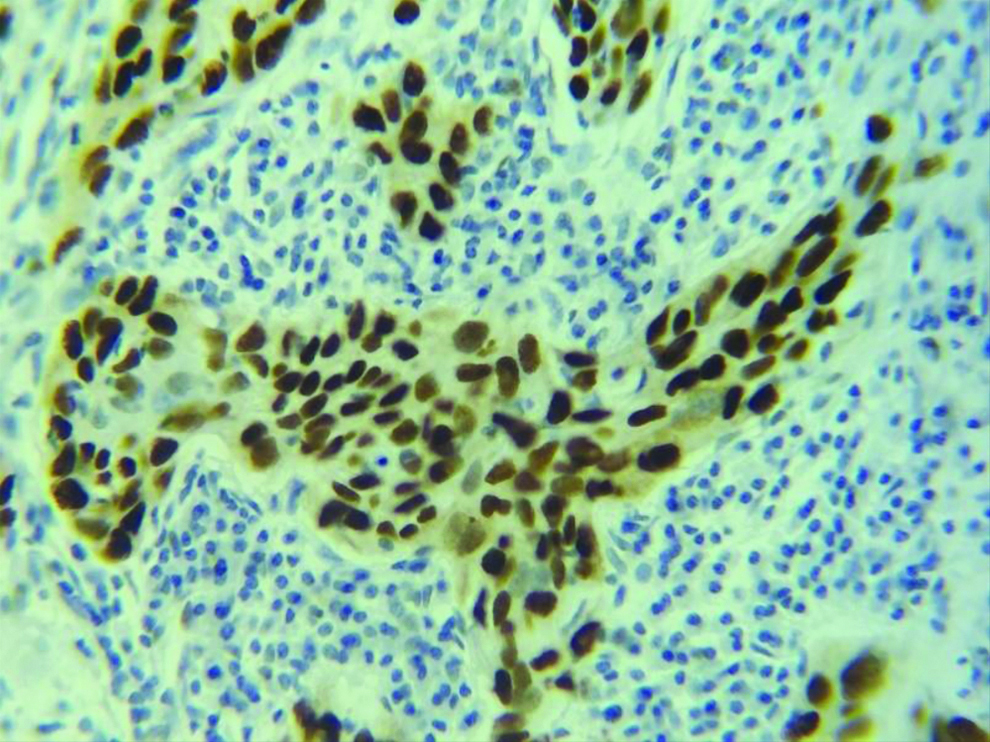
Section stained with immunohistochemical stain (p53) (high power view: 40x) showing score 2 p53 expression (immuno-expression between 50-75%). Malignant squamous cells with brown coloured nuclear staining for p53 are seen.
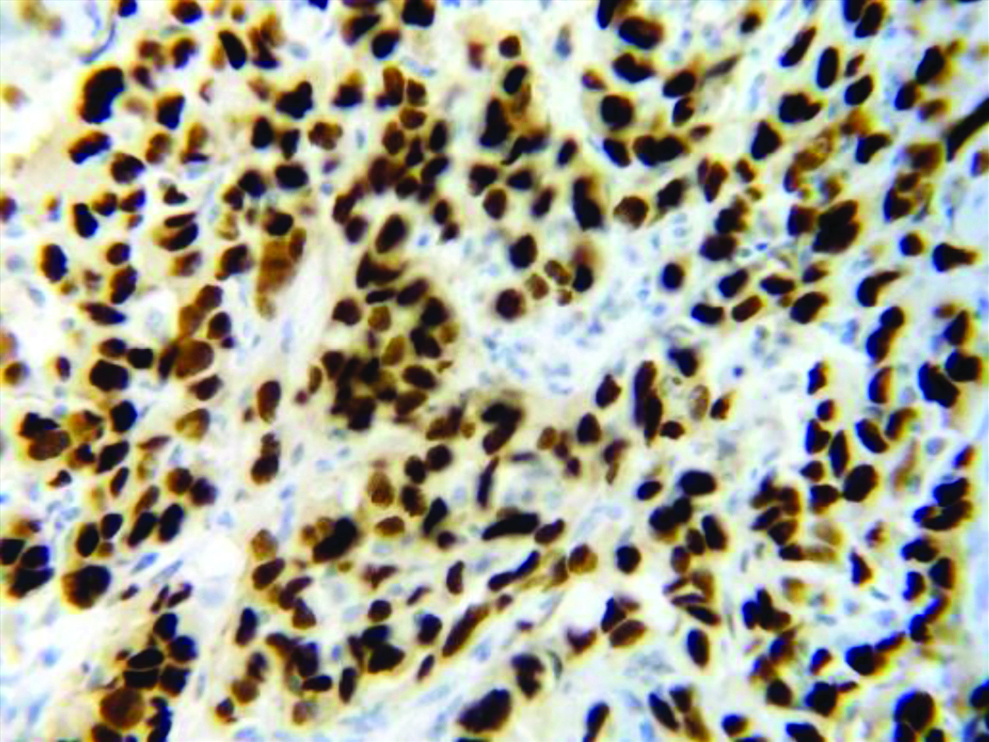
Section stained with immunohistochemical stain (p53) (high power view: 40x) showing score 3 p53 expression (immuno-expression more than 75%).
Hence, the present study concludes a positive correlation between the proliferative markers AgNOR (histochemical parameter) and p53 (immunohistochemical parameter) with the histological grade of OSCC that evaluation of AgNORs and p53 can be used as a dependable adjunct in the gold standard method of histological grading of OSCC.
Limitation(s)
The usefulness of evaluating the AgNOR score and the p53 expression is subject to inter-observer variations. This limitation can be eliminated by applying the digital image analysis tool. The mean AgNOR count obtained is only a rough estimate of the ploidy status and the proliferative rate of the cell. There are no cut-off values set as such. Improper tissue sampling and tumour heterogeneity can lead to low p53 expression. Deviating from standardised staining techniques may lead to artefacts culminating in erroneous results while evaluating the AgNOR scores and the p53 expression.
Conclusion(s)
The present study concludes a positive correlation between the histopathological grades of OSCC and nuclear proliferative markers on histochemistry (AgNOR count) and immunohistochemistry (p53 expression). It implies that these nuclear proliferative markers provide a supportive clue to the clinician and the histopathologist to predict the rate of proliferation and helps to understand the biological behaviour of the tumour. They help to bridge the gap that arises due to inter-observer variability while diagnosing different grades of OSCC. The study also concludes that these biomarkers can prove to be dependable adjuncts along with histopathological grading of OSCC which is the gold standard method of diagnosis.
The recent diagnostic modality of implementing proliferative biomarkers as adjuncts to correlate between the histological grade and clinico-pathological parameters is recommended for better prognostication, determining the choice of treatment and predicting the tumour behaviour. Determination of histochemical and immunohistochemical profile and its association with the histo-pathological grade and clinical aspects should become a routine practice among the pathologists and clinicians to facilitate better treatment outcome in patients with OSCC.