About 85% proximal humerus fractures are found to be non-displaced or minimally displaced and the fragments are held together by attachments of tendons of rotator cuff, joint capsule and intact periosteum so, these fractures can be managed conservatively with satisfactory results [2]. In rest 15% proximal humeral fractures, one or more of the major segments are displaced and are associated with soft tissue injuries. They are often unstable, could be associated with distortion of rotator mechanism and even loss of circulation to head that may lead to avascular necrosis of head [5]. Avascular necrosis of head is found in 12-34% cases of three-part fracture and 41-59% cases of four part fractures [6].
These fractures are often disabling and complex, therefore they require surgeon’s competence. These fractures could be managed both surgically and conservatively. Eighty-five percent minimally or non-displaced fractures are amenable to simple treatment by three weeks of immobilisation followed by early functional exercises resulting in good outcome. In spite of early union and exercise programme by conservative treatment the problem of shoulder stiffness is common and could be quite disabling in young active individuals [1]. To overcome this problem, early mobilisation is mandatory which is not possible in conservative treatment before three weeks. It could be achieved surgically by the use of locking plate, JESS and percutaneous K-wires. Following surgical methods can be used for these fractures:
Closed reduction and percutaneous K-wire fixation is a minimally invasive method but has limited indications. This method could be practiced in two-part fracture and three- or four-part fractures with good bone stock. The advantage of this technique is that it requires minimal dissection, and thus less disruption to the vascular supply of the humeral head than the open techniques, less postoperative pain, less operative time and blood loss. The disadvantage of this technique includes stiffness, pin tract infection migration of K-wire, and loss of reduction [7].
Close reduction and external fixation of the proximal humerus fractures by JESS is an alternative method of treatment. Studies have indicated good functional outcome for two to three-part fractures but not for four-part fractures. They are especially useful in patients with osteoporosis in which internal fixation failure may occur [8]. Open reduction and internal fixation by locking compression plates function as internal fixator by securing an anatomical reduction. Advantage of these implants are no surgical damage of rotator cuff, high resistance to avulsion even in osteopaenic bone due to angular stability and three-dimensional placement of the screws in the head of humerus [9].
The aim of this study was to compare the functional outcome between these four common methods of managing these fractures namely locking plate, JESS, percutaneous K-wire fixation and conservative method.
Materials and Methods
This was a hospital based prospective study conducted in the Department of Orthopaedic Surgery, Gandhi Memorial and Associated Hospital, King George’s Medical University, Lucknow.
Ethical clearance was taken from the Institutional Ethics Committee prior to the study (KGMU/EC/R-CELL/2013/189). The informed consent was obtained.
Inclusion criteria: Patients of proximal humerus fracture above 18 years of age and with duration of injury less than 2 weeks between August 2011 to August 2013, treated by locking plate, external fixator, K-wire fixation and conservative method of treatment were included in the study.
Exclusion criteria: Patients with previous fractures of involved shoulder or any other fracture of the same limb, patients with history of previous neuromuscular weakness (polio, myopathies etc.,) were excluded from the study.
Murray IR et al., outlined the recommendations for proximal humerus fractures in which surgical treatment should be considered [10]:
Fractures with involvement of the articular surface of the humeral head.
Two-part fracture of greater or lesser tuberosity, or three- and/or four-part fractures with displacement of greater tuberosity more than 1 cm.
Unstable two-part fractures of surgical neck in which shaft is displaced from the humeral head due to displacement or extensive metaphyseal comminution.
Two-, three- or four-part fractures with varus or valgus deformity of the humeral head to the shaft by >30° from the normal head shaft inclination angle of 130°.
Following the above-mentioned recommendations, undisplaced two part fractures were treated by conservative method while three-part and displaced fractures were treated by one of the above mentioned surgical methods. Compound fractures needing surgical intervention were managed by JESS application while simple fractures in the old age with osteoporotic bone were managed by K-wire fixation. Young patients with comminuted fracture were managed by open reduction and locking compression plate application. Initially we had total 42 patients which were as follows:
Group A (n=17) patients managed by open reduction and internal fixation by locking compression plate, Group B (n=7) patients managed by JESS application, Group C (n=7) patients managed by K-wire fixation, Group D (n=11) patients managed by conservative method.
Conservative management consists of pain relief and immobilisation in a sling or shoulder immobiliser for two weeks. After two weeks of immobilisation passive motion was started where as active and assisted shoulder range of motion was started after four weeks. Patients were followed with serial radiographs to evaluate for fracture displacement. According to the recommendation of Khmelnitskaya E et al., radiographs were taken at two weeks (prior to initiation of motion) and then again at 3 weeks to ensure fracture stability [4].
The patients were followed-up in 4 parts: 3 weeks, 6 weeks, 12 weeks, 18 weeks and thereafter every 6 weeks’ interval till 9 months. Cases were evaluated for functional results by using the Swanson Shoulder Score [11] and Constant Scoring System (Modified) [12].
Statistical Analysis
After collection of the data, analysis was carried out on Statistical Package for the Social Sciences (SPSS) software version 16.0 (Chicago, inc. USA) and chi-square test, Paired t-test, one-way ANOVA, Multiple logistic regression statistical test was used. p-value of <0.05 was considered significant.
Results
At the end of the study, total 42 patients in the four groups viz., A, B, C and D were present. Out of 42 patients 32 (76.19%) were males and 10 (23.81%) female patients. In this study, most of the patients were of 31-40 years followed by 21-30 years [Table/Fig-1].
Age and sex distribution of patients.
| Age in years | Groups |
|---|
| Group A | Group B | Group C | Group D |
|---|
| (n=17) | (n=7) | (n=7) | (n=11) |
|---|
| No. (%) | No. (%) | No. (%) | No. (%) |
|---|
| ≤20 | 0 (0.0) | 1 (14.3) | 1 (14.3) | 1 (9.1) |
| 21-30 | 3 (17.6) | 4 (57.1) | 1 (14.3) | 2 (18.2) |
| 31-40 | 8 (47.1) | 2 (28.6) | 2 (28.6) | 2 (18.2) |
| 41-50 | 3 (17.6) | 0 (0.0) | 1 (14.3) | 0 (0.0) |
| 51-60 | 2 (11.8) | 0 (0.0) | 0 (0.0) | 4 (36.4) |
| 61-70 | 1 (5.9) | 0 (0.0) | 2 (28.6) | 1 (9.1) |
| 71-80 | 0 (0.0) | 0 (0.0) | 0 (0.0) | 1 (9.1) |
| Male | 12 (70.6) | 6 (85.7) | 5 (71.4) | 9 (81.8) |
| Female | 5 (29.4) | 1 (14.3) | 2 (28.6) | 2 (18.2) |
Statistical test applied-simple proportion.
There were 17 patients in the Group ‘A’ {12 male (70.6%) and 5 female (29.4%)}, 7 patients in the Group ‘B’ {6 male (85.7%) and 1 female (14.3%), 7 patients in the Group ‘C’ {5 male (71.4%) and 2 female (28.6%)} and 11 patients in Group ‘D’ {9 male (81.8%) and 2 female (18.2%)} [Table/Fig-1].
Fall on ground was found to be the most common mode of injury [Table/Fig-2]. Neer’s type 3 and 4 were more common in age 31-40 year age group and Neer’s type 2 fractures were more common in 51-60 year age group [Table/Fig-3]. Group A patients had minimum time for mobilisation from the day of surgery (2.06±1.71 weeks) while group D patients had the maximum time for mobilisation (4.73±1.84 weeks) [Table/Fig-4]. Patients of group A were found to take minimum time for union, while group D patients took the maximum time [Table/Fig-5]. At 6 weeks the range of motion was maximum in group A patients and the difference was significant [Table/Fig-6]. At 3 months follow-up the range of motion improved in all the groups but the improvement was maximum in group A and minimum in group D and the difference was significant [Table/Fig-7]. At 9 months, there were only 22 patients under our follow-up and rest of the patients were lost to follow-up (group A=7, group B=3, group C=6, group D=6). Range of motion was maximum for group ‘A’ followed by group ‘B’ and minimum for group ‘C’ and ‘D’ [Table/Fig-8]. At 3 months follow-up, group A (70.6%) had the maximum number of patients with excellent score as per Swanson shoulder score, and modified constant Score (88.2%) [Table/Fig-9,10].
| Mode of injury | Groups |
|---|
| Group A (n=17) | Group B (n=7) | Group C (n=7) | Group D (n=11) |
|---|
| No. % | No. % | No. % | No. % |
|---|
| RTA | 1 (5.9) | 3 (42.9) | 0 (0.0) | 9 (81.8) |
| Fall on ground | 12 (70.6) | 4 (57.1) | 6 (85.7) | 2 (18.2) |
| Others | 4 (23.5) | 0 (0.0) | 1 (14.3) | 0 (0.0) |
RTA: Road traffic accident, Others-Mode of injury other than RTA and fall on ground.
Statistical test applied-simple proportion
Distribution of patients according to type of fracture (Neer’s type).
| Age in years | Neer’s fracture types |
|---|
| 2 part | 3 part | 4 part |
|---|
| No. | % | No. | % | No. | % |
|---|
| ≤20 | 2 | 66.7 | 1 | 33.3 | 0 | 0.0 |
| 21-30 | 3 | 30.0 | 7 | 70.0 | 0 | 0.0 |
| 31-40 | 2 | 14.3 | 8 | 57.1 | 0 | 28.6 |
| 41-50 | 0 | 0.0 | 3 | 75.0 | 1 | 25.0 |
| 51-60 | 4 | 66.7 | 2 | 33.3 | 4 | 0.0 |
| 61-70 | 1 | 25.0 | 3 | 75.0 | 0 | 0.0 |
| 71-80 | 1 | 100.0 | 0 | 0.0 | 0 | 0.0 |
χ2=12.30, p=0.14, Statistical test applied-Chi-square test
Average time of initiation of Shoulder mobilisation in Groups (in weeks).
| Groups | No. of patients | Mean±SD | Min-max |
|---|
| Group A | 17 | 2.06±1.71* | 1-6 |
| Group B | 7 | 3.14±1.46 | 1-6 |
| Group C | 7 | 3.71±0.75 | 1-3 |
| Group D | 11 | 4.73±1.84* | 1-6 |
p=0.001, *p<0.05, Statistical test Applied-Analysis of variance test (ANOVA); SD: Standard deviation
Average time for Clinical and Radiological union (weeks) at 3 months follow-up.
| Groups | No. of patients | Mean±SD | Min-max |
|---|
| Group A | 17 | 7.65±1.05 | 6-10 |
| Group B | 7 | 8.00±0.00 | 8-8 |
| Group C | 7 | 8.00±0.00 | 8-8 |
| Group D | 11 | 8.18±0.60 | 6-10 |
Statistical test applied-Chi-square test; SD: Standard deviation
Comparison of range of motion at 6 weeks among the groups.
| Range of motion | Group A (N=17) | Group B (N=7) | Group C (N=7) | Group D (N=11) | Anova p-value |
|---|
| Abduction | 93.25±11.981,2,3 | 71.42±8.991 | 62.14±23.062 | 60.90±20.343 | 0.001* |
| Flexion | 61.76±28.441,2,3 | 34.28±18.121 | 28.57±7.482 | 26.81±6.433 | 0.001* |
| Extension | 37.35±3.992,3 | 29.28±10.57 | 27.14±7.552 | 25.90±7.013 | 0.001* |
| External rotation | 33.82±4.511,2,3 | 25.71±1.881 | 24.28±5.342 | 22.27±6.063 | 0.001* |
| Internal rotation | 40.29±9.261,2,3 | 27.85±5.661 | 25.00±7.632 | 24.09±8.313 | 0.001* |
| Adduction | 17.35±3.121,2,3 | 11.42±2.431 | 11.43±2.442 | 11.42±2.333 | 0.001* |
1p<0.05, 2p<0.01, 3p<0.0001. Statistical test applied=(Multiple comparison tests); *Significant
Comparison of range of motion at 3 months among the groups.
| Range of motion | Group A (N=17) | Group B (N=7) | Group C (N=7) | Group D (N=11) | Anova p-value |
|---|
| Abduction | 104.41±15.991,2 | 90.71±39.62 | 74.29±20.701 | 72.27±24.222 | 0.03* |
| Flexion | 75.29±31.391,2,3 | 53.57±28.09 | 42.14±14.962 | 40.90±19.473 | 0.005* |
| Extension | 39.41±7.681 | 33.57±12.81 | 30.00±6.45 | 28.63±8.091 | 0.01* |
| External rotation | 47.94±5.011,2 | 41.42±2.43 | 35.00±7.631 | 34.55±14.392 | 0.001* |
| Internal rotation | 59.94±9.852 | 47.14±3.93 | 42.86±13.49 | 40.45±6.502 | 0.005 |
| Adduction | 25.88±8.521,2 | 21.43±4.75 | 17.14±2.671 | 16.81±2.522 | 0.001 |
*Significant, 1p<0.05, 2p<0.01, 3p<0.0001. Statistical test applied=(Multiple comparison tests)
Comparison of Range of Motion at 9 month among the Groups.
| Range of motion | Group A (n=7) | Group B (n=3) | Group C (n=6) | Group D (n=6) | ANOVA p-value |
|---|
| Abduction | 127.86±13.222,3 | 118.33±25.65 | 97.5±6.122 | 94.17±9.173 | 0.0001* |
| Flexion | 81.42±14.601,2,3 | 53.33±11.541 | 50.00±10.952 | 48.33±11.693 | 0.0001* |
| Extension | 58.66±6.262,3 | 56.66±5.77 | 42.5±11.722 | 35.00±7.743 | 0.0001* |
| External rotation | 40.00±9.571 | 38.33±5.77 | 35.93±9.70 | 26.55±13.411 | 0.03* |
| Internal rotation | 58.57±8.521 | 46.67±5.77 | 43.33±14.72 | 40.83±6.641 | 0.02* |
| Adduction | 27.85±8.091 | 23.33±2.88 | 21.67±2.58 | 19.17±2.041 | 0.04* |
*Significant, 1p<0.05, 2p<0.01, 3p<0.0001, Statistical test applied-Multiple comparison test
Functional results as per Swanson’s Shoulder Score at 3 month.
| Functional Results | Groups |
|---|
| Group A (N=17) | Group B (N=7) | Group C (N=7) | Group D (N=11) |
|---|
| No. | % | No. | % | No. | % | No. | % |
|---|
| Poor | 0 | 0.0 | 0 | 0.0 | 0 | 0.0 | 0 | 0.0 |
| Fair | 0 | 0.0 | 1 | 14.3 | 1 | 14.3 | 3 | 27.3 |
| Good | 5 | 29.4 | 6 | 85.7 | 6 | 85.7 | 8 | 72.7 |
| Excellent | 12 | 70.6 | 0 | 0.0 | 0 | 0.0 | 0 | 0.0 |
χ2=18.30, p=0.004. Statistical test applied=Chi-square test
Functional results as per modified constant shoulder score at 3 month.
| Functional Results | Groups |
|---|
| Group A (N=17) | Group B (N=7) | Group C (N=7) | Group D (N=11) |
|---|
| No. | % | No. | % | No. | % | No. | % |
|---|
| Poor | 0 | 0.0 | 0 | 0.0 | 2 | 28.6 | 1 | 9.1 |
| Fair | 0 | 0.0 | 3 | 42.9 | 3 | 42.9 | 6 | 54.5 |
| Good | 2 | 11.8 | 4 | 57.1 | 2 | 28.6 | 4 | 36.4 |
| Excellent | 15 | 88.2 | 0 | 0.0 | 0 | 0.0 | 0 | 0.0 |
χ2=14.99, p=0.02. Statistical test applied=Chi-square test
At 9 months’ follow-up, group A patients (85.7%) had maximum number of excellent scores as per Swanson shoulder score [Table/Fig-11]. At 9 months’ follow-up, according to modified constant shoulder score the percentage of excellent score in group A was maximum [Table/Fig-12]. There was significant increase in the Swanson’s shoulder score at 9 months’ follow-up as compared to follow-up at three months in all the groups [Table/Fig-13]. The mean constant shoulder score increased in all groups at 9 months of follow-up as compared to 3 months of follow-up except in group D [Table/Fig-14]. This can be due to the fact that the maximum number of patients in group D were elderly and were less compliant to physiotherapy and were more likely to suffer from medical comorbidities.
Functional results as per Swanson’s Shoulder Score at 9 month.
| Functional Results | Groups |
|---|
| Group A | Group B | Group C | Group D |
|---|
| (N=7) | (N=3) | (N=6) | (N=6) |
|---|
| No. | No. | No. | No. |
|---|
| Poor | 0 (0.0) | 0 (0.0) | 0 (0.0) | 0 (0.0) |
| Fair | 0 (0.0) | 0 (0.0) | 0 (0.0) | 6 (100.0) |
| Good | 1 (14.3) | 2 (66.7) | 5 (83.3) | 0 (0.0) |
| Excellent | 6 (85.7) | 1 (33.3) | 1 (16.7) | 0 (0.0) |
χ2=9.57, p=0.02, Statistical test Applied-Chi-square test
Functional results as per Modified constant shoulder score at 9 months.
| Functional Results | Groups |
|---|
| Group A | Group B | Group C | Group D |
|---|
| (N=7) | (N=3) | (N=6) | (N=6) |
|---|
| No. (%) | No. (%) | No. (%) | No. (%) |
|---|
| Poor | 0 (0.0) | 0 (0.0) | 0 (0.0) | 0 (0.0) |
| Fair | 1 (14.3) | 1 (33.3) | 3 (50.0) | 4 (66.7) |
| Good | 0 (0.0) | 2 (66.7) | 3 (50.0) | 2 (33.3) |
| Excellent | 6 (85.7) | 0 (0.0) | 0 (0.0) | 0 (0.0) |
χ2=1.91, p=0.59, Statistical test Applied-Chi-square test.
Comparison of Swanson’s shoulder score among the groups.
| Groups | 3 month | 9 month |
|---|
| No. of patients | Mean±SD | No. of patients | Mean±SD |
|---|
| Group A | 17 | 25.68±1.371,2 | 7 | 26.24±1.181 |
| Group B | 7 | 23.71±1.93 | 3 | 24.97±0.90 |
| Group C | 7 | 21.97±1.722 | 6 | 24.13±0.99 |
| Group D | 11 | 21.17±1.722 | 6 | 22.77±2.831 |
| ANOVA p-value | | 0.001* | | 0.01* |
*Significant, 1p<0.01, 2p<0.001, 3p<0.0001 (Statistical test Applied-Multiple comparison test); SD: Standard deviation
Comparison of Modified Constant score among the groups.
| Groups | 3 month | 9 month |
|---|
| No. of patients | Mean±SD | No. of patients | Mean±SD |
|---|
| Group A | 17 | 72.21±2.981,2 | 7 | 74.00±2.763 |
| Group B | 7 | 69.71±4.15 | 3 | 72.33±2.51 |
| Group C | 7 | 64.00±5.911 | 6 | 70.50±3.20 |
| Group D | 11 | 63.09±7.392 | 6 | 61.33±5.533 |
| ANOVA p-value | 0.001* | 0.0001* |
*Significant, 1p<0.01, 2p<0.001, 3p<0.0001 (Statistical test Applied-Multiple comparison test); SD: Standard deviation
Discussion
Fractures of proximal end of humerus, which were initially considered to be geriatric injuries, are now increasingly seen in younger age group and that too in predominantly active ones with good bone stock [3]. Closed reduction of proximal humerus fracture requires careful study of the radiograph which must be available in at least two planes [13]. An assessment of the residual soft tissue attachment of various fragments is necessary and important to achieve full benefit from ligamentotaxis. The treatment options for the fracture of proximal humerus are wide and a surgeon has to decide the modality of treatment on the basis of fracture pattern, soft tissue injury, concomitant injuries, general condition of patient, osteoporosis and patient related factors like rehabilitation potential, functional expectations of the patient, and life expectancy.
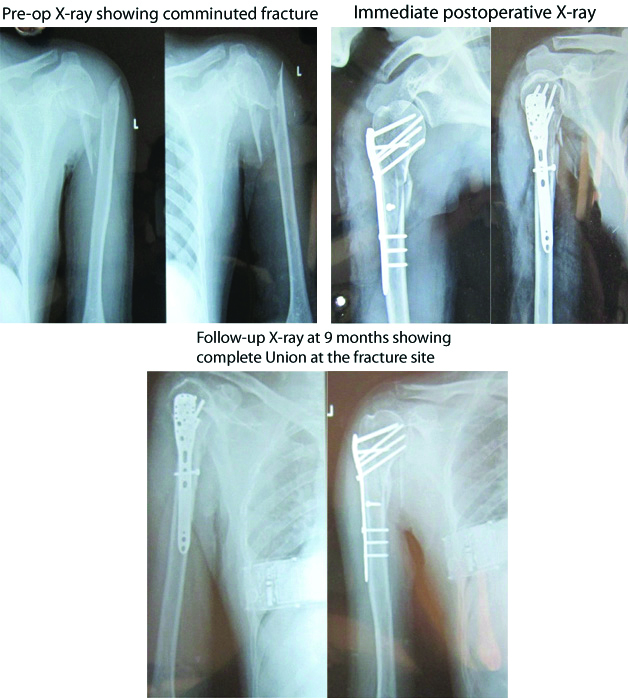
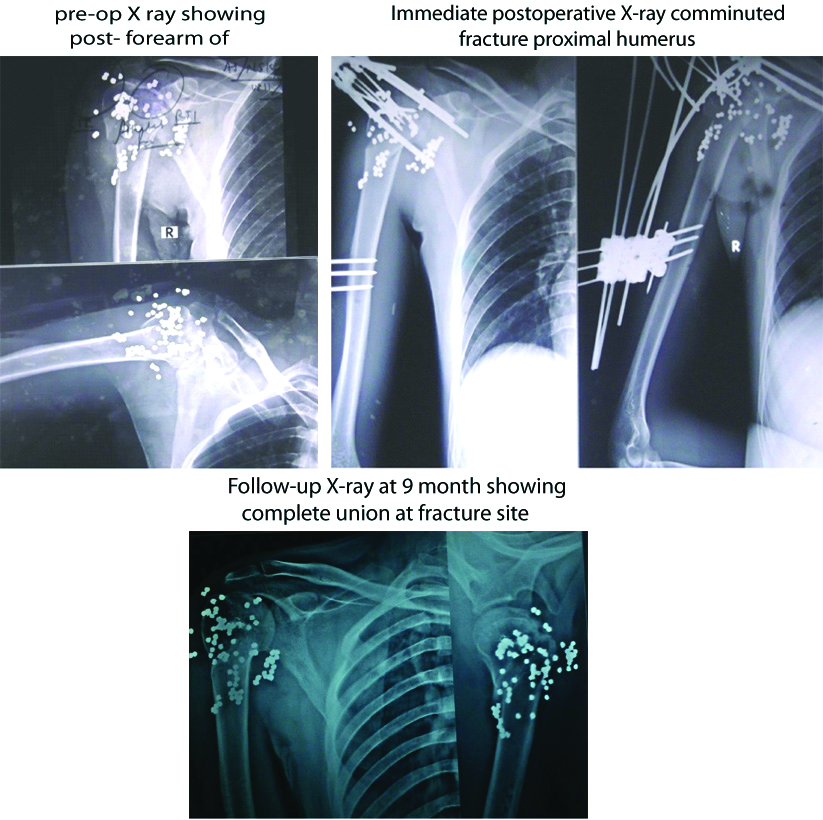
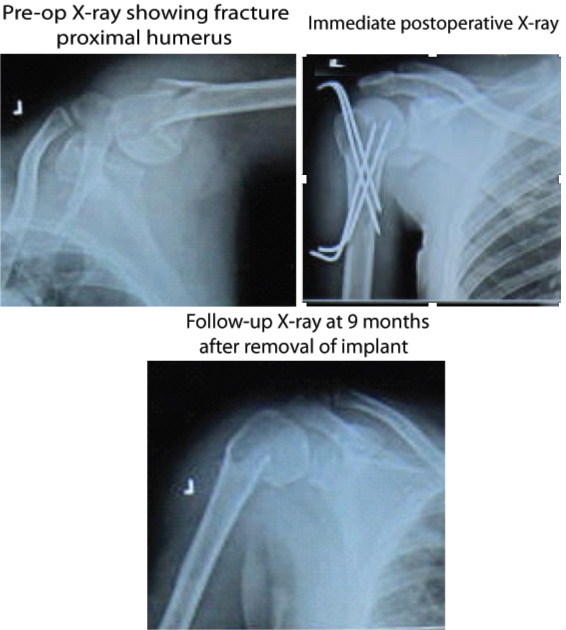
In case of group A [Table/Fig-15] and group B [Table/Fig-16] mobilisation was started on second postoperative day after checking dressing. In group C [Table/Fig-17], mobilisation could only be started after two weeks but in conservatively managed cases, mobilisation was allowed only after three weeks of arm to chest strapping or cuff and collar sling.
Serial radiographs of patient with proximal humerus fracture managed by open reduction and internal fixation by locking compression plate (Group A).
Serial radiographs of patient with post firearm compound fracture proximal humerus managed by debridement and external fixation with JESS (Group B).
Serial radiographs of patient with proximal humerus fracture managed by close reduction and internal fixation by K-wire (Group C).
Restriction in range of movements was greater in conservative group probably because of increased bursal and capsular adhesions whereas in the operative group there was little restriction which was insignificant.
There was improvement in the functional status of patients from six weeks to three months in all the four groups. The improvement from six weeks to three months was found to be better in locked plate than the other three groups. Patients managed conservatively improved at a slower pace and required longer time. Even at the end of three months, the range of movements were comparatively lower in majority of the patients. The patients managed operatively improved better in the postoperative period i.e., the recovery was greater and earlier.
In two patients of JESS, pin-track infection was found, which responded well to dressing and antibiotics. No infection was serious enough to require removal of pin or any other secondary procedure. One observation was inferior subluxation of head postoperatively. In this study, it was due to deltoid weakness and redundant shoulder capsule. This subluxation improved on active resistive exercises. At 9 months of follow-up according to modified constant shoulder score, 6 (85.7%) of group A patients had excellent scores, and the percentage of good score in group B was 66.7% followed by group C (50%) and D (33.3%).
Fankhauser F et al., reported 28 patients with 29 proximal humerus fractures treated with a Locking Proximal Humerus Plate (LPHP) using a deltoid splitting approach [14]. After one year, the average constant score for all fractures was 75. Similarly, in this study average mean constant score at final follow-up in group A patients was 74 (range 71-77). Jaura GS et al., compared plating with locking compression plate (Group 1) with K-wire fixation (Group 2) in proximal humerus in 60 patients. They reported mean constant score of 84.6 in Group 1 and 76.4 (range: 56-100) in Group 2 at final follow-up. They found satisfactory results in both the groups, with each procedure having its advantages and shortcomings [15]. Similarly, in the current study, average constant score in the locking plate group (74.00±2.76) was comparable to K-wire fixation group (70.50±3.20). Gupta AK et al., reported mean constant score of 78.1 in 16 patients treated with Joshi external stabilisation system and that external fixation with JESS was an excellent modality of treatment for Neer’s two- and three-part fractures [8]. The present study also supports the above mentioned study with a mean constant score of 72.3.
Proximal humerus fractures are still a topic of debate regarding the best management of these fractures because different authors have different results in their studies. Thus, the present study indicates that locking plate osteosynthesis is the standard operative procedure in displaced two-, three- and four-part fractures of proximal humerus. Also, the choice of treatment should be individualised and should be based on careful evaluation of patient-specific, fracture-specific and surgeon-specific aspects.
Limitation(s)
The main limitation of our study was small sample size and short duration of follow-up. Furthermore, in this study the number of subjects in each group was not equal. So, a study with a larger sample size and more follow-up duration will provide better evidence regarding the outcome of treatment with these treatment modalities.
Conclusion(s)
The study concluded that for early union and good range of motion in proximal humerus fractures, operative treatment should be considered. Among the surgical modalities locking compression plate has got the best functional results.
Statistical test applied-simple proportion.
RTA: Road traffic accident, Others-Mode of injury other than RTA and fall on ground.
Statistical test applied-simple proportion
χ2=12.30, p=0.14, Statistical test applied-Chi-square test
p=0.001, *p<0.05, Statistical test Applied-Analysis of variance test (ANOVA); SD: Standard deviation
Statistical test applied-Chi-square test; SD: Standard deviation
1p<0.05, 2p<0.01, 3p<0.0001. Statistical test applied=(Multiple comparison tests); *Significant
*Significant, 1p<0.05, 2p<0.01, 3p<0.0001. Statistical test applied=(Multiple comparison tests)
*Significant, 1p<0.05, 2p<0.01, 3p<0.0001, Statistical test applied-Multiple comparison test
χ2=18.30, p=0.004. Statistical test applied=Chi-square test
χ2=14.99, p=0.02. Statistical test applied=Chi-square test
χ2=9.57, p=0.02, Statistical test Applied-Chi-square test
χ2=1.91, p=0.59, Statistical test Applied-Chi-square test.
*Significant, 1p<0.01, 2p<0.001, 3p<0.0001 (Statistical test Applied-Multiple comparison test); SD: Standard deviation
*Significant, 1p<0.01, 2p<0.001, 3p<0.0001 (Statistical test Applied-Multiple comparison test); SD: Standard deviation