Materials and Methods
Animals
An experimental animal study was carried out in the Institute for Industrial Research and Toxicology, Ghaziabad, Uttar Pradesh, India. All the procedures and protocols were duly approved by the institute with Institutional Animal Ethics Committee (IAEC) protocol no. IIRT/IAEC/2020/021. Preformulation and formulation work along with entire characterisation of formulation was done from January 2019 to February 2020 and afterwards animal study was done from March 2020 to June 2020. Young adult male Wistar rats (weight between 180 to 220 gm, n=10, total three groups viz., Control, RFB plain drug group and RFB nanocarrier group were studied in the present research work. In each group 10 animals were taken) for the entire study and were housed under humane conditions, with alternating 12-hour light and 12-hour dark cycles at 22-25°C, under the guidelines of veterinary control and after the approval from the ethical committee of Institute for Industrial Research and Toxicology, Ghaziabad, India. They were fed on chow diet throughout the experiments with free access to potable water.
Materials
RFB was obtained as a gift sample from Research Centre, Lupin Ltd., Pune. The lipid Glyceryl Monostearate (GMS) was obtained from Sasol, Germany as a gift sample. Oleic acid and Tween 80 were purchased from Fisher Scientific, USA. All other solvents, chemicals and reagents were procured as analytical grade, while mobile phase solvents were of HPLC grade and obtained from standard companies.
Formulation of Rifabutin (RFB) Nanostructured Lipid Carriers (NLC)
The RFB NLC was prepared by solvent diffusion evaporation method with minor modifications. RFB, GMS and Oleic Acid were dissolved as drug: lipid: oil ratio at 1: 2: 0.5 w/w/w in ethanol by heating at 60-70°C and the resulted solution mixture was added drop wise to1% v/v surfactant mixture of Tween 80 and Transcutol P (in ratio of 1: 1 w/w) solution maintained at 60-70°C, under mechanical stirring. To evaporate the ethanol, resulted secondary emulsion was kept overnight under continuous stirring. For recovery of the formulated nanoparticles which were centrifuged at 18,000 rpm for 60 minutes thereafter washed with distilled water and further the formulation was lyophilised.
Characterisation of Rifabutin (RFB) NLC
The RFB loaded NLC formulation was characterised for its physicochemical properties i.e., surface morphology by using the FESEM. Dynamic Light Scattering (DLS) method (Zetasizer Nano ZS, Malvern, USA) was used for analysis of average particle size, PDI, and surface charge. The percentage of drug encapsulation efficiency (% EE) and the Drug Loading efficiency (DL) (mg/g) was analysed with the help of HPLC. The crystalline state of the drug before and after nanoparticle formation was determined by XRD. Further, in-vitro drug release were studied by using the equilibrium dialysis method in different dissolution medias like Simulated Gastric Fluid {(SGF, pH=2.0), SIF, pH=6.8 and PBS, pH=7.4} and the amount of drug release was calculated by HPLC method as mentioned below.
HPLC Analysis of Rifabutin (RFB)
The drug RFB was estimated on HPLC system (Jasco) with UV detector. Analysis was performed on a stainless steel column 12.5 cm×4.6 mm, packed with end capped octadecylsilane amorphous organosilica polymer (5 μm) as L7. Mobile phase comprised of a mixture of acetonitrile along with 0.1M monobasic potassium phosphate (50:50). Adjust by dropwise addition of 2M sodium hydroxide to a pH of 6.5±0.1. Filter through a 0.5 μm or finer porosity filter and degas at a 1.0 mL/min flow rate and 254 nm wavelength of detection.
Pharmacokinetics and Biodistribution
Drug Administration
For dissolution of hydrophobic drugs, dimethyl sulphoxide was used. Drug and its Nanostructured Lipid Crystals (NLCs) were dissolved in dimethyl sulphoxide before administration and around 100-200 μL of the same containing therapeutic dose of the drug i.e., 300 mg/kg body weight was given orally through gavage to rats.
Collection of Blood and Preparation of Serum
Blood was collected from each rat from retro orbital complex and to prevent lysing, immediately the collected blood was transferred into clean Ethylenediaminetetraacetic Acid (EDTA) and plain centrifuge tube bottles. Part of the blood sample was centrifuged at 5000 rpm for 10 minutes and the supernatant obtained i.e., plasma was transferred into sample bottles which was then duly labelled. They were stored at 40°C for further analysis. In each group after the administration of drug the animals were bled at the time interval of 30 minutes, 60 minutes, two hours, three hours, four hours, six hours, six hours, 12 hours and 24 hours. After 24 hours the animals were bled every 24 hours for next seven days. The plasma concentration vs. time profilecurves for the drug and formulations were estimated from the non-compartmental pharmacokinetic model. Data interpretation was done by using KineticaTM and pharmacokinetic parameters such as Cmax, Tmax, AUC,t1/2, Mean Residence Time (MRT) were calculated [17-21].
Estimation of the Haematological Parameters
Haematological profile or parameters covers estimation of Haemoglobin (HGB), Red Blood Cell (RBC) count, Packed Cell Volume (PCV), Platelets (PLT), White Blood Cell (WBC), Neutrophils (NEU), Lymphocytes (LYMP), Eosinophils, Monocytes and Clotting time in different groups using Councell -21 system from Tulip Diagnostic (Pvt.,) Ltd., the estimation was performed as per the protocol from the manufacturer [21].
Liver Profile Analysis
The serum enzyme clinical biochemistry of Aspartate Amino-Transferase (AST), Alkaline Phosphatase (ALP), Alanine Aminotransferase (ALT), Total bilirubin was evaluated to determine the enzymatic activities of the liver in different groups. Commercially available kits from Trans Asia Bio-Medicals Limited, Mumbai, India was used to measure the activity of all serum enzymes as per the protocol from the manufacturer [21].
Free Radical Analysis
The estimation of the Superoxide Dismutase (SOD) activity was performed on the basis of superoxide radical generation by xanthine and xanthine oxidase. These compounds react with iodophenyl-3-(4-nitrophenol)-5-phenyltetrazolium chloride that form a red coloured formazon dye. The assay was performed on serum briefly 300 uL of mixed substrate added to 200 μL of serum and 75 μL of xanthine oxidase was added, the value was than measured at 505 nm.
The glutathione values were estimated in serum on the basis of Ellman’s method [22]. The method is based on the reaction of thiols with Ellmans reagent (5,5′-dithiobis-(2-nitrobenzoic acid) or DTNB), in this reaction the thiols cleaved the disulfide bond of Ellmans reagent to give 2-nitro-5-thiobenzoate (TNB-)2-nitro-5-thiobenzoate (TNB-). In the serum the formation of (TNB-) was estimated using spectrophotometer at 412 nm and the values were then compared with standard curve with known Glutathione (GSH) value for calculation of the values [23]. The serum activity of catalase was estimated on the basis of method of Hadwan MH and Abed HN, in this method the samples were allowed to incubate with H2O2 in Tris HCl buffer, a yellow coloured complex was formed and measured spectrophotometrically at 410 nm when the reaction was terminated by adding 4% ammonium molybdate. The catalse activity in serum was calculated as the amount of enzyme required to decompose 1 μmoL H2O2 per minute. In the current study, the thiobarbituric acid reaction method was used to estimate the Malondialdehyde (MDA) levels in serum [24]. This method is based on the absorption comparison of the samples with standard curve of MDA equivalent generated by tetramethoxypropane. A working mixture of 15% trichloroacetic acid, 0.375% thiobarbituric acid, and 0.25 N hydrochloric acids was prepared. For analysis of MDA in serum, 250 μL serum was allowed to react with 500 μL working mixture in boiling water for 10 minutes. After 10 minutes the samples were allowed to cool and centrifuged at 3000 rpm. A 200 μL of supernatant from different samples were taken out into microplates and the optical density of the samples was measured at 535 nm. The values of MDA were expressed in μmol/L.
Estimation of Drug from Blood
Analytical Method
The Reversed-phase HPLC (Agilent infinity 1220 LC) method was validated for linearity, accuracy, precision (Interday precision, Intraday precision), repeatability and robustness. RP-HPLC method was developed on C-18 column (250×4.6 mm, 5 μm) with UV detector. Mobile phase containing acetonitrile and ammonium acetate buffer (55:45 v/v) pH 4.5 was used. The flow rate was 1.25 mL/min and effluents were analysed at wavelength of 240 nm.
Toxicity Studies
MTT Assay
MTT {3-(4, 5-dimethylthiazol-2yl)-2, 5-diphenyltetrazolium} assay was performed to access the cell viability [26]. The assay is based on reduction of soluble yellow tetrazolium into insoluble purple formazan crystals; the reduction emerged by mitochondrial dehydrogenase in metabolic active cells. Therefore, the rate of formazan crystal formation is directly proportional to number of viable cells. The absorbance of sample is directly proportional to cell viability.
In the present study, the MTT assay was performed to evaluate the cell viability of nano-lipoidal RFB to plain drug. The study was performed on HeLa cells. HeLa Cells were seeded at a concentration of 0.35×10⁶ cells/mL in 96 well plate with Dulbecco’s Modified Eagle Medium (DMEM) media containing 10% Fetal Bovine Serum (FBS) and 1% Penicillin-Streptomycin incubated at 37° C in 5% CO2 incubator.
After 12 hours of seeding, the cells were treated with different concentration of plain RFB and nanocarrier of RFB. After addition of the drug, the cells were incubated for 24, 48, 72 hours at 37° C, further 10 μL MTT was added (5 mg/mL stock in 1×PBS pH 7.4), to make final concentration to 0.5 mg/mL. After incubation at 37° C in CO2 incubator for four hours in dark, the media was removed and formazan crystals were dissolved in 100 μL of DMSO. The crystals were then measured by BioRAD ELISA reader at 570 nm and 690 nm reference wavelength, respectively.
The percentage of cell viability was calculated by comparing the control cell with differently treated groups at different time points. The calculation of cell viability was accessed on the basis of the formula:

Where, (A)test is the test sample absorbance
(A)control is the control sample absorbance.
Haemolytic Toxicity
Haemolytic Toxicity is a serious liability for any drug or formulation before its use. For any drug or its formulation toxic haemolysis data has to be a necessary requirement. The assay is based on the estimation of HGB release in the plasma as an indicator of RBC lysis after the treatment or submission of test compound [26]. In the present study, the known plain RFB drug was compared with formulated nano lipoidal carrier for the haemolytic toxicity if any. The blood from the rats was collected in EDTA vial from the retro orbital complex. The collected blood was then subjected to therapeutic dose of plain RFB drug and the same dose level was also used for nano lipoidal formulation for 45 minutes at 37°C, the above procedure was repeated thrice for each dose. The RBC was separated from the collected blood and was suspended into normal saline solution to obtain 10% haematocrit value. Distilled water was used as a positive control. The HGB in plasma after lysis was estimated by spectrophotometric method at 542 nm.
The results were calculated and the % haemolysis was calculated using the formula:

Where, ABs=absorbance of the sample,
AB100=absorbance of the control.
Statistical Analysis
GraphPad Prism Software (Version 5.02) was used for the statistical analysis. The results were expressed as Mean±SEM, and significant differences in results at 95% confidence interval which were determined by one-way ANOVA followed by Dunnett’s test. Differences with p<0.05 were considered statistically significant.
Results
Characterisation of Rifabutin (RFB) NLC
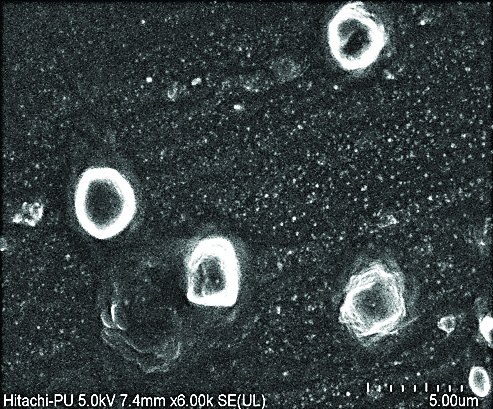
Spherical shape of RFB NLC was confirmed by the FESEM image [Table/Fig-1]. The image represents the nanocarrier loaded with RFB as like vesicular arrangement with distinct outer boundary and drug loaded inside. The RFB nanocarrier evaluated for various parameters as detailed in [Table/Fig-2].
Field Emission Scanning Electron Microscopy (FESEM) image of Rifabutin (RFB) nanocarrier.
Characterisation of nanoparticles.
| Evaluation parameter | Rifabutin loaded nanocarrier |
|---|
| Particle size (nm) | 315±10.96 |
| PDI | 0.310±0.05 |
| Zeta (mV) | 26±2.1 |
| EE (%) | 66.3±3.85 |
| Drug loading (mg/gm) | 220 |
Values (n=3) are mean±SD. N represents number of times experiment repeated to confirm the results so its value is expressed in mean±SD
On encapsulation, the RFB-NLC showed an amorphous pattern of drug interspersed with characteristic crystalline peaks of lipid indicating that, though majority of RFB is entrapped inside NLC, some drug is adsorbed on the surface of nanoparticles. Initially, there was a 16-20 % release of the drug within six hours which reaches to the 30% at the end of 24 hours, followed by slow and sustained release and at the end of 7 days the release was about 45%. The initial burst release may be from the surface of nanocarrier, while the subsequent phase of slow and sustained release may be due to slow release through diffusion or membrane-controlled release. The release kinetic studies showed that Korsmeyer-Peppas model governs diffusion mediated drug release from the aforesaid nanocarrier system.
Pharmacokinetic and Biodistribution
RFB and its nanocarrier administered in single dose in the rats, the nanocarrier showed sustained and longer duration drug release pattern in plasma above its MIC whereas, the RFB plain drug was cleared from the circulation within 18-24 hours [Table/Fig-3].
Plasma concentration profile curve for Rifabutin (RFB) and Rifabutin nanocarrier.
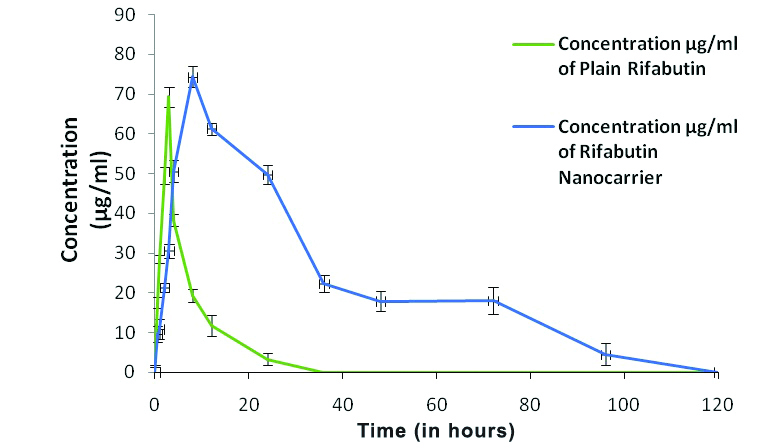
Cmax and Tmax of RFB nanocarrier significantly differed from the plain drug. However, the AUC0-∞ (μg.h)/mL and the Mean Residence Time (MRT) for nanocarrier significantly (p<0.001) increased as compared to a plain RFB [Table/Fig-4].
Pharmacokinetic parameters of Rifabutin (RFB) plain drug and Rifabutin nanocarrier.
| Parameters | Rifabutin plain drug | Rifabutin nanocarrier |
|---|
| Cmax (μg/mL) | 2.9±1.47 | 3.44±1.74 |
| Tmax (h) | 2.10±1.10 | 64±1.62 |
| kel | 0.18±0.011 | 0.01±0.003 |
| t1/2 (h) | 3.92±0.58 | 12.89±4.19 |
| AUC0-∞ (μg.h)/mL | 24.13±4.16 | 183.74±3.35*** |
| MRT (h) | 4.90±1.23 | 41.11±3.02*** |
| Relative bioavailability | 1 | 5.8 |
***p<0.001 as compared with the plain drug group (mean±SD)
After the administration of nanocarrier, the availability of RFB in sustained manner above the MIC for more than three days, favours its therapeutic goal in treatment of tuberculosis and MAC infection, where the infection is localised and frequency of drug intake can be reduced as the drug is available for longer duration.
Toxicity Studies
MTT assay
MTT assay result clearly indicates that nano-lipoidal carrier formulation have cell protective role when compared with plain drug. The Optical Density (OD) values in the [Table/Fig-5] shows that nano-lipoidal carrier OD at 48 hours and at 72 hours was significantly higher than the plain drug, so on the basis of these findings it can be concluded that the nano-lipoidal carrier formulation have normal cell protection properties that has to be exploited for human benefit.
Cytotoxicity study data for the Rifabutin (RFB) plain drug and its nanocarrier.
PC=Positive control, Rif Plain=RFB Plain drug, Rif Nano=RFB
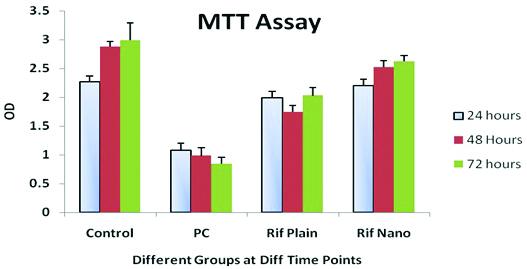
MTT or Hela Cell Viability Assay at different time points viz., 24 hours, 48 hours and 72 hours after exposure to different treatments [Table/Fig-5]. Nanocarrier, here in control group cells were allowed to grow in normal medium without any modification detailed in the [Table/Fig-5]. The control is untreated cell, while in case of positive control the cells were treated with Dimethyl Sulfoxide (DMSO) at 0.8% concentration level.
Haemolytic toxicity
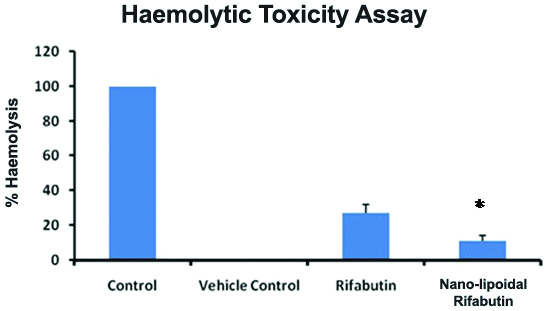
Plain RFB and its nanocarrier were evaluated for haemolytic toxicity study to predict the toxicity of drug and its dosage form after the administration. In distilled water, RBCs placed resulted in several clusters, clumping, and fragments due to complete lysis. While in RFB nanocarrier the RBC’s appeared as normal, intact and well separated similar to the Normal Saline. [Table/Fig-6] portrays the % haemolysis data which were observed by absorbance method in test samples viz., plain drug RFB and its nanocarrier were found to be 27±2.6 and 11±2.1 respectively, as compared to the control group. The less haemolysis in case of RFB nanocarrier might be due to its good biocompatibility wrt., the plain drug, which indicates that the nanocarrier formulated as a potential drug delivery system with less toxicity score and more efficacy.
Estimation of the Haematological Parameters
The haematological parameters were analysed as detailed in [Table/Fig-7], at Day 0 i.e., starting time of dosing and at 24 hours, and at 72 hours. On the basis of the result, it is concluded that haematological parameters are close and no significant change in the haematological parameters were observed between the groups.
Haemolytic Toxicity Assay of the Rifabutin (RFB) plain drug and its nanocarrier.
* p<0.05 when compared with RFB plain drug
Haematological parameters of Rifabutin- (RFB) plain drug and rifabutin nanocarrier.
| Parameters | Day 0: (Two day before starting of experiment) Before intervention | 24 hrs after intervention | 72 hrs after intervention |
|---|
| Rifabutin plain drug (RFT) | Rifabutin nanocarrier (RFT-NLC) | Rifabutin plain drug (RFT) | Rifabutin nanocarrier (RFT-NLC) | Rifabutin plain drug (RFT) | Rifabutin nanocarrier (RFT-NLC) |
|---|
| WBC (103/μL) | 9.11±0.87 | 9.18±1.05 | 8.54±0.81 | 9.25±1.12 | 18.24±0.45 | 14.05±1.13 |
| RBC (106/μL) | 3.41±0.35 | 3.99±0.42 | 3.91±0.32 | 4.01±0.39 | 4.11±0.28 | 4.98±0.41 |
| Hb (g/dL) | 12.57±0.84 | 12.25±0.58 | 11.41±0.82 | 12.05±0.41 | 8.82±0.74 | 9.34±0.25 |
| PCV (%) | 38.15±1.15 | 37.75±1.11 | 35.82±1.11 | 36.15±1.09 | 35.74±1.22 | 36.25±1.11 |
| Reticulocyte (%) | 1.01±0.12 | 1.02±0.12 | 1.11±0.10 | 1.07±0.14 | 1.14±0.12 | 1.11±0.12 |
| Platelet count 105/mm3 | 995.11±22.48 | 998.11±21.17 | 999.12±21.32 | 988.22±32.25 | 1012±20.25 | 1018.24±25.45 |
| Clotting time (Sec.) | 111.45±0.97 | 108.17±0.88 | 111.15±0.94 | 109.57±0.89 | 110.20±0.84 | 109.48±0.49 |
| Neutrophils | 21.7 | 22.7 | 22.2 | 22.9 | 22.5 | 23.2 |
| Lymphocytes | 75.7 | 74.6 | 75.2 | 74.5 | 75.1 | 74.1 |
| Monocytes | 1.36 | 1.38 | 1.34 | 1.4 | 1.3 | 1.37 |
| Eosinophils | 1.24 | 1.32 | 1.26 | 1.2 | 1.1 | 1.33 |
(Avg.±SD; n=10)
Estimation of the Liver Profile Parameters
Total Bilirubin, ALT, Aspartate aminotransferase and ALP were analysed as detailed in [Table/Fig-8] at three different time points during the study. On the basis the observations, no change in the liver profile enzyme levels were observed in nanocarrier encapsulated drug when compared with plain drug.
Liver profile analysis of Rifabutin (RFB) plain drug and nanocarrier of rifabutin.
| Parameters | Control day 0 | 24 hrs after intervention | 72 hrs after intervention |
|---|
| Rifabutin plain drug (RFT) | Rifabutin nanocarrier (RFT-NLC) | Rifabutin plain drug (RFT) | Rifabutin nanocarrier (RFT-NLC) |
|---|
| Total Bilrubin (μmol/L) | 13.05±1.25 | 11.91±0.87 | 11.74±0.42 | 12.41±1.05 | 11.71±0.35 |
| Alanine Aminotransferase (U/L) | 28.74±1.25 | 29.17±2.01 | 25.72±1.12 | 28.27±1.71 | 28.32±1.29 |
| Aspartate Aminotransferase (IU/L) | 21.58±1.22 | 21.22±0.91 | 21.42±0.83 | 21.78±1.21 | 22.17±1.18 |
| Alkaline Phosphatase (IU/L) | 74.28±5.82 | 77.81±6.82 | 71.32±7.86 | 74.44±5.42 | 73.38±5.46 |
(Avg.±SD; n=10)
Free Radical Analysis
Free radical analysis was done for the SOD, Catalase, GSH and MDA were analysed in serum at 3 time points during the study: 0 hours, 24 hours and 72 hours. On the basis the observations as detailed in [Table/Fig-9] it is clear that nano particle encapsulated drug does not produce any free radicals when compared to plain drug and results were not statistically significant.
Free Radical analysis of Rifabutin (RFB) plain drug and nanocarrier of rifabutin.
| Parameters | Control day 0 | 24 hrs after Intervention | 72 hrs after intervention |
|---|
| Rifabutin plain drug (RFT) | Rifabutin nanocarrier (RFT-NLC) | Rifabutin plain drug (RFT) | Rifabutin nanocarrier (RFT-NLC) |
|---|
| SOD | 9.23±0.52 | 09.02±0.38 | 9.74±0.39 | 9.71±0.27 | 10.17±0.30 |
| Catalase | 29.27±2.29 | 68.25±3.25 | 62.35±4.28 | 69.27±2.29 | 68.85±4.11 |
| GSH | 54.82±1.11 | 54.52±1.02 | 54.98±1.08 | 55.92±0.95 | 51.42±1.02 |
| MDA (nmol/L) | 1.11±0.18 | 1.21±0.08 | 1.11±0.57 | 1.22±0.22 | 1.31±0.86 |
(Avg.±SD; n=10)
Discussion
The present study explores that the nano-lipoidal drug formulation has a potential to be a carrier for the drug RFB which addresses major issues of the drug i.e., large dose, toxicity, and dosing frequency, which leads to poor patient compliance [8,10]. The developed nanocarrier revealed that its particle size was 305-325 nm with low PDI of 0.26-0.36 and the high drug encapsulation efficiency (62.45-70.15%) [Table/Fig-2]. Further nanocarrier showed a sustained release pattern in in-vitro release study wherein initial burst release followed by membrane-controlled release or slow release through diffusion [25,26].
In previous research studies [10,15] RFB drug has one of the major challenges that clinicians all over the world are trying to address which is the low oral bioavailability. Referring to that, in present research the in-vivo study showed that the nano-lipoidal drug formulation has significant higher Tmax and Cmax plasma value with higher t1/2(h) values in comparison to plain drug [Table/Fig-3], Moreover, the slow elimination rate (Kel) resulted in significant (p<0.001) prolonged half-life (t1/2), which was many folds higher than the plain drug [Table/Fig-4]. Further one of the major issues with the toxicity of RFB drug is due to the large dose and its frequency [8,10,15] and in reference to that, the in-vitro studies for the formulated nano-lipoidal encapsulated drug showed that there was an increased cell survival rate in MTT assay as compared to normal drug [Table/Fig-5]. The haemolytic toxicity assay showed that % haemolysis was also significantly reduced when compared to plain drug [Table/Fig-6]. The haemolytic assay finding clearly indicates that the nano-lipoidal drug formulation has a potential to be a carrier for the drug delivery with less toxicity score and with more efficacy. No significant change was observed in haematological, liver enzyme profile and free radical analysis of rats in plain drug and drug with nano-lipoidal carrier [Table/Fig-7,8 and 9]. These findings strongly advocated the possibility of reduction of dose, dosing frequency of RFB with nano-lipoidal carrier and the increase in bioavailability of the drug for longer duration. Further, the biodistribution studies revealed that the nano-lipoidal RFB drug was present in higher concentration over the alveolar macrophage against the normal plain drug. This results in increased localised concentration gradient and observation of the drug for prolonged duration, this property of nano-lipoidal formulation favours its application against tuberculosis where the infection is localised to tissue only [3,7,12,17]. Therefore, on the basis of present findings it can be concluded that the present novel nanocarrier formulation has a reduced dose, dosing frequency and toxic side effects which ultimately increases the patient compliance, which is a promising approach for the better management of MTb.
Limitation(s)
However, the targeting strategy of nano-lipoidal carrier formulation may be limited due to lack of possible study in animals after tuberculosis induction, that may involve the study of nano-lipoidal targeting ligands e.g., receptor ligands interaction with nano-carrier surface that enables the internalisation of the nano-carrier into the targeted cells and its release. Also the stability of nano-carrier formulation has to be established for this novel formulation for commercial purposes.
Conclusion(s)
The present multiple in-vitro and in-vivo studies revealed that the nano-lipoidal carrier formulation for RFB have succeeded to improve the delivery of therapeutic benefit of the drug, with also the Nano-lipoidal RFB formulation showed a sustained release pattern in SIF up to 48 hours and in PBS up to 7 days with a significant increase in MRT and a half-life of drug. These findings suggest that the Nano-lipoidal RFB with better safety profile and enhanced pharmacokinetic properties will be used in future drug delivery system.