One of the most common endocrine metabolic diseases affecting women of reproductive age group is PCOS. The characteristic features of PCOS are chronic anovulation, polycystic ovaries and hyperandrogenism. Manifestations of hyperandrogenism can either be clinical or biochemical. Insulin resistance (IR) and obesity are often found associated with this syndrome. Endocrine abnormalities of PCOS can cause disturbances in the functioning of ovaries, hypothalamus, adrenals, pituitary, liver, pancreas and adipose tissue [1]. A number of risk factors for coronary artery disease (CAD) like type 2 diabetes, elevated triglyceride to high-density lipoprotein (HDL) ratio, MetS vascular dysfunction and IR are found in PCOS affected women [2]. According to the population studied and the diagnostic criteria, prevalence of PCOS in India ranges from 3.7 to 22.5% [3].
Cardiovascular Disease (CVD) is now a major public health problem and is the leading cause of mortality in India. Both sexes are equally affected with a prevalence of 50 per 1000 among men and 52.5 per 1000 among women [4]. Women with PCOS are at higher risk of developing CVD because of ovulatory dysfunction, decreased estradiol, increased BP, cholesterol, and weight are the established risk factors. The pathophysiology of PCOS is mainly contributed by obesity. The most commonly used indicator to assess obesity is BMI. But BMI only measures obesity in general, not the body fat distribution [5,6]. Central obesity, contributed by visceral fat and subcutaneous fat is associated with more severe metabolic disturbances like MetS and CVDs than general obesity [7].
The LAP is an abdominal adiposity marker based on WC and fasting triglycerides, and has advantage over BMI in recognising CVD risk [8]. PCOS patients with altered LAP are at a higher risk of developing CVD [9]. The advantage of using LAP as a risk predictor is that it is an easy, cost-effective way to asses CVD risk [8]. Research on the relation of LAP with PCOS and whether LAP can be used as a predictive marker for the development of CVD is not much probed from South Kerala. The aim of present study was to find out the association between LAP and cardiovascular risk factors in women with PCOS.
Materials and Methods
Study Design
This case-control study was conducted in the Department of Biochemistry, Government Medical College, Thiruvananthapuram, Kerala, India. The subjects chosen for the study were those women who came on an outpatient basis in the Infertility Clinic, Department of Obstetrics and Gynaecology, SAT Hospital, Government Medical College, Thiruvananthapuram from November 2010 to April 2011. The study was conducted in accordance with the Declaration of Helsinki and subsequent revisions and was conducted only after the approval of the Institutional Ethical Committee (IEC.No.05/02/2010). Written informed consent was obtained from all subjects.
Sample Size Calculation
Sample size was calculated using the formula:
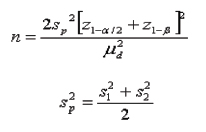
Where,
S12: Standard deviation in the first group
S22: Standard deviation in the second group
μd2: Mean difference between the samples
α: Significance level
1-β: Power
In a similar study reported from Brazil [10],
Taking mean =median and standard deviation=IQR/1.35
Mean1: m1 = 20.89, Mean2: m2= 37.87, s1=32.64, s2=19.77
μd= m1-m2=16.98; Type I error α=5%; Type II error β=20%
Substituting the values in the above formula for calculating sample size, 40 was the minimum number of samples required in each group.
Inclusion Criteria
Cases
Cases were 48 women with PCOS in the reproductive age group (20-35 years). The criteria for diagnosing PCOS was by Rotterdam ESHRE/ASRM sponsored PCOS consensus workshop group [11].
PCOS can be diagnosed based on the presence of any 2 out of the 3 criteria:
Oligo- and/or anovulation (Annually ≤8 menstrual periods).
Clinical signs of hyperandrogenism (such as hirsutism, acanthosis nigricans, acne). Hirsutism was assesd by using modified Ferryman Gallaway score. A score of ≥8 was taken as hirsutism.
Polycystic ovaries with the exclusion of other aetiologies. The morphology of polycystic ovary is defined as an ovary with 12 or more follicles measuring 2-9 mm in diameter and/or increased ovarian volume (more than 10 cm3) in ultrasonogram [11].
Controls
Controls were 48 age and BMI-matched healthy women with regular menstrual cycles, no clinical signs of hyperandrogenism and not on any medication, who were attending the Fertility clinic.
Exclusion Criteria
Women with diabetes mellitus, cardiovascular diseases, hyperprolactinemia, thyroid dysfunction, Cushing syndrome, androgen-secreting tumours or late-onset congenital adrenal hyperplasia were excluded.
After obtaining written informed consent, demographic data, detailed history including menstrual history, past medical history and family history was recorded. Triplicate resting blood pressure measurements were recorded in accordance to the standard protocols. Anthropometric parameters like height and weight were recorded for all cases and controls.
Study Procedure
Under aseptic precautions, 5 mL blood was drawn in the fasting state and one part of collected sample was transferred to sodium fluoride tubes for estimation of FPG. Plasma glucose estimation was done by the glucose oxidase method [12], serum cholesterol by the end point enzymatic method [13] and triglyceride by end point method (GPO Trinder method) [14]. HDL (High density lipoprotein) was estimated by enzymatic method. The value of low-density lipoprotein (LDL) was determined from the values of total cholesterol, HDL and triglyceride, by using the Friedwald's formulae [15].
LAP was calculated using the formula [16], Female LAP={waist (cm)-58} × TG concentration (mmol/L). Patient was defined as having MetS based on the National Cholesterol Education Program Adult Treatment Panel III (NCEP ATP-III) guidelines [17].
Statistical Analysis
Data analysis was performed using R software (R version 3.6.2 (2019-12-12) and Statistical Package for the Social Sciences (SPSS) statistical package (version 16.0). Mean and standard deviation were used to express continuous variables and proportion for categorical variables. Normality of the continuous variables were tested using the Kolmogorov-Smirnov test. As the data on continuous variable was not having normal distribution, log transformation was used to normalise it so that parametric tests like Student’s t-test could be applied. In univariate analysis, comparison of continuous variables between two groups was analysed by unpaired t-test and that of categorical variables were analysed by Chi-square test. Correlations between continuous variables were tested using the Pearson correlation or Spearman correlation coefficient (r) analysis. A p-value <0.05 was considered as statistically significant. Multiple linear regression model was used to estimate LAP as an independent risk factor for CVD, adjusting for other factors. Variables significant at the 0.1 level were included in the multivariate analysis. Receiver Operating Characteristic (ROC) curve was plotted to assess the optimum cut-off value of LAP. Diagram was constructed using R software {R version 3.6.2 (2019-12-12)}, Microsoft excel and GraphPad Prism.
Results
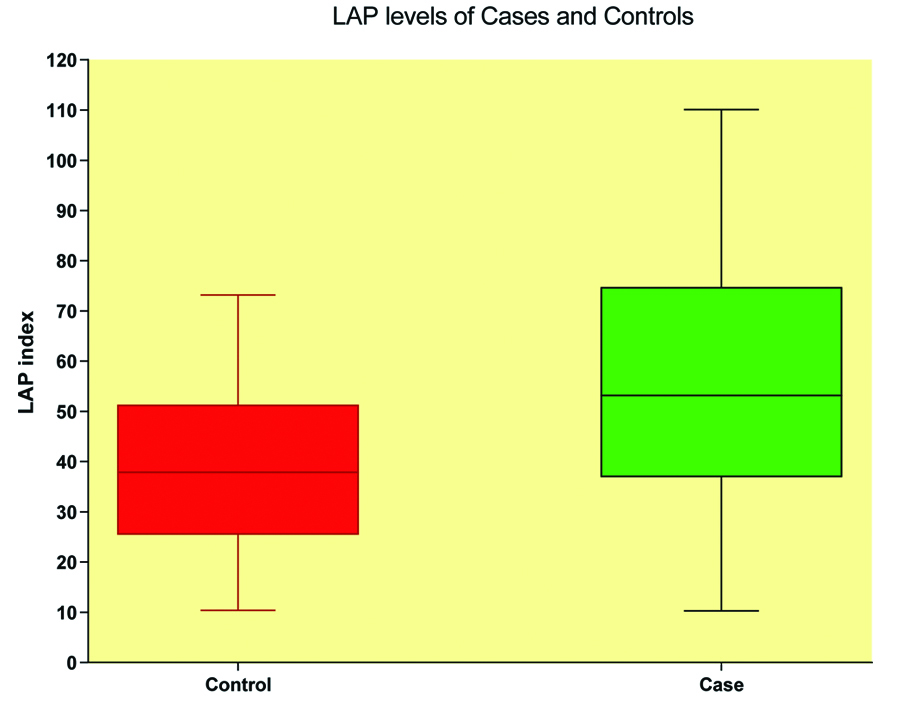
Results were expressed as mean±standard deviation. The mean age of the case group was 26.6±4.3 years and that of control group was 27.0±4.4 years (p-value of 0.638). BMI of cases (26.2±3.6 kg/m2) against controls (25.6±3.1 kg/m2) with a p-value of 0.37 was also not significantly different. So the cases and controls were matched for age and BMI. The mean WC of PCOS patients (93.6±7.6 cm) was significantly higher compared to healthy controls (88.2±9.4 cm) (p-value 0.003). There was a significant difference in mean triglyceride level between the groups (131.6±44.8 mg/dL in cases and 112.0±26.9 mg/dL in controls, p-value 0.011). The mean LAP index in cases was 54.5±24.0 cm.mmol/L and in controls 38.9±16.6 cm.mmol/L (p-value <0.001) showing a significantly higher LAP in PCOS women [Table/Fig-1]. The mean systolic (124.9±11.2 mmHg) and diastolic (81.2±5.2 mmHg) blood pressures were significantly higher in PCOS women compared to controls (118.5±3.6 mmHg and 77.7±3.7 mmHg, respectively). The mean HDL level was significantly lower in case group (38.5±9.2 mg/dL) compared to the control group (47.0±8.4 mg/dL, p-value <0.001) [Table/Fig-2]. No significant difference in the means of total cholesterol and LDL cholesterol were noted between case and control groups. There was significant difference in the level of FBS between the two groups (91.7±8.3 mg/dL in cases and 85.6±6.7 mg/dL in controls, p-value <0.001).
Boxplot diagram showing LAP index among cases and controls.
Lower and upper end of the whisker represents minimum and maximum LAP levels of each category. Lower border of the box represents 25th percentile and upper border represents 75th percentile. Middle horizontal line represents median level of LAP index.
Anthropometric and biochemical parameters of the study groups.
| Parameters | Control (n=48) | Case (n=48) | p-value |
|---|
| Age (years) | 27.0±4.4 | 26.6±4.3 | 0.638 |
| Metabolic syndrome* | 2 (4.2) | 16 (33.3) | <0.001 |
| Height (cms) | 154.1±5.2 | 154.4±5.0 | 0.749 |
| Weight (kg) | 60.8±7.2 | 62.7±9.0 | 0.257 |
| BMI (kg/m2) | 25.6±3.1 | 26.2±3.6 | 0.37 |
| WC (cm) | 88.2±9.4 | 93.6±7.6 | 0.003 |
| Total cholesterol (mg/dL) | 187.0±32.4 | 193.4±40.5 | 0.393 |
| TG (mg/dL) | 112.0±26.9 | 131.6±44.8 | 0.011 |
| HDL (mg/dL) | 47.0±8.4 | 38.5±9.2 | <0.001 |
| LDL (mg/dL) | 115.9±33.0 | 128.2±34.5 | 0.078 |
| FBS (mg/dL) | 85.6±6.7 | 91.7±8.3 | <0.001 |
| SBP (mmHg) | 118.5±3.6 | 124.9±11.2 | <0.001 |
| DBP (mmHg) | 77.7±3.7 | 81.2±5.2 | <0.001 |
| LAP (cm.mmol/L) | 38.9±16.6 | 54.5±24.0 | <0.001 |
Values expressed as mean±SD. Student’s t-test was done.
*Expressed as number (Percentage). Chi-square test was employed; BMI: Body mass index; WC: Waist circumference; TG: Triglceride; HDL: High density lipopotein; LDL: Low density lipopotein; FBS; Fasting blood sugar; SBP: Systolic blood pressure; DBP: Diastolic blood pressure; LAP: Lipid accumulation product; p-value <0.05 significant
The percentage distribution of MetS among PCOS women was 33.3% compared to 4.2% in controls [Table/Fig-3]. Chi-square test with a p-value of <0.001 suggests a higher prevalence of MetS among PCOS women compared to healthy controls. Women with MetS had significantly higher BMI, WC, triglycerides, BP, and lower HDL levels [Table/Fig-4] than those without MetS. The mean LAP index was significantly higher in women with MetS (75.8±16.6) compared to women with no MetS (39.9±17.0) [Table/Fig-4,5].
Percentage distribution of metabolic syndrome among cases and controls.
| Metabolic syndrome | Control | Case | Total | χ2 | df | p-value |
|---|
| N | % | N | % | N | % |
|---|
| Absent | 46 | 95.8 | 32 | 66.7 | 78 | 81.2 | 13.402 | 1 | <0.001 |
| Present | 2 | 4.2 | 16 | 33.3 | 18 | 18.8 |
| Total | 48 | 100.0 | 48 | 100.0 | 96 | 100.0 | | | |
Chi-square test was done with significant
Comparison of study variables between metabolic syndrome and non-metabolic syndrome.
| Variables | Metabolic syndrome | t | p-value |
|---|
| Absent (n=78) | Present (n=18) |
|---|
| Age (years) | 27.1 ±4.2 | 25.7±4.7 | 1.254 | 0.213 |
| Height (cms) | 154.3±5.3 | 154.0±4.3 | 0.212 | 0.833 |
| Weight (kg) | 60.8±7.7 | 65.9±9.2 | 2.444 | 0.016 |
| BMI (kg/m2) | 25.4±3.2 | 27.9±3.4 | 2.965 | 0.004 |
| WC (cm) | 89.6±9.1 | 96.7±5.2 | 3.165 | 0.002 |
| Total cholesterol (mg/dL) | 188.3±36.8 | 198.1±35.4 | 1.022 | 0.309 |
| TG (mg/dL) | 109.9±29.2 | 173.4±27.9 | 8.391 | <0.001 |
| HDL (mg/dL) | 44.5±8.9 | 35.0±9.8 | 4.017 | <0.001 |
| LDL (mg/dL) | 120.9±34.0 | 127.0±35.0 | 0.684 | 0.496 |
| FBS (mg/dL) | 88.2±7.8 | 90.6±9.2 | 1.144 | 0.256 |
| SBP (mmHg) | 118.7±5.5 | 134.9±8.6 | 10.071 | <0.001 |
| DBP (mmHg) | 78.1±3.8 | 85.5±4.0 | 7.391 | <0.001 |
| LAP (cm.mmol/L) | 39.9±17.0 | 75.8±16.6 | 8.092 | <0.001 |
Values expressed as mean±SD. Student’s t-test was done. p-value <0.05 is considered as significant
Scatter dot plot showing LAP levels of women with and without metabolic syndrome.
Middle horizontal line in each column represents mean LAP levels and error bar on either side of middle line represents mean±SD

The results of correlation analysis showed a positive and significant correlation between LAP and weight (r=0.592; p<0.001), BMI (r=0.724; p<0.001), WC (r=0.757; p<0.001), Total Cholesterol (r=0.444; p<0.001), Triglyceride (r=0.862; p<0.001), LDL (r=0.355; p<0.001), SBP (r=0.618; p<0.001) and DBP (r=0.606; p-value <0.001). A significant negative correlation was obtained between LAP and HDL (r=0.224; p<0.028) [Table/Fig-6].
Correlation of CVD risk markers with LAP.
| Correlation of CVD risk markers with LAP | Pearson correlation coefficient r | p-value |
|---|
| Age | 0.066 | 0.526 |
| Weight | 0.592** | <0.001 |
| BMI | 0.724** | <0.001 |
| WC | 0.757** | <0.001 |
| Total cholesterol | 0.444** | <0.001 |
| TG | 0.862** | <0.001 |
| HDL | -0.224* | 0.028 |
| LDL | 0.355** | <0.001 |
| FBS | 0.225* | 0.028 |
| SBP | 0.618** | <0.001 |
| DBP | 0.606** | <0.001 |
p-value <0.05 is considered significant; **correlation is significant at the 0.01 level; *correlation is significant at the 0.05 level
Multiple linear regression analysis was done and LAP (p<0.001) was found to be an independent risk factor for CVD, after adjusting other factors [Table/Fig-7]. ROC curve was plotted and the best cut-off point for the LAP index to predict cardiovascular risk in PCOS was >52.85 cm.mmol/L (sensitivity: 54.17%, specificity: 79.17%) with a Positive Predictive Value of 72.2% [Table/Fig-8,9].
Multiple linear regression model for the estimation of LAP as an independent risk factor for CVD.
| Unstandardised coefficients | t | p-value |
|---|
| B coefficient | Standard error |
|---|
| (Constant) | -114.742 | 6.757 | -16.98 | <0.001 |
| Category | 2.136 | 0.803 | 2.66 | 0.009 |
| Metabolic syndrome | 1.651 | 1.47 | 1.123 | 0.264 |
| BMI | 1.065 | 0.244 | 4.363 | <0.001 |
| WC | 0.868 | 0.093 | 9.286 | <0.001 |
| T.Cholestrol | -0.007 | 0.011 | -0.615 | 0.540 |
| TG | 0.364 | 0.013 | 27.729 | <0.001 |
| Systolic BP | 0.086 | 0.058 | 1.488 | 0.140 |
Adjusted R square=0.979 standard error=3.19; F7,88=629.146; p<0.001
Receiver operating characteristic (ROC) curves for LAP to predict CVD.
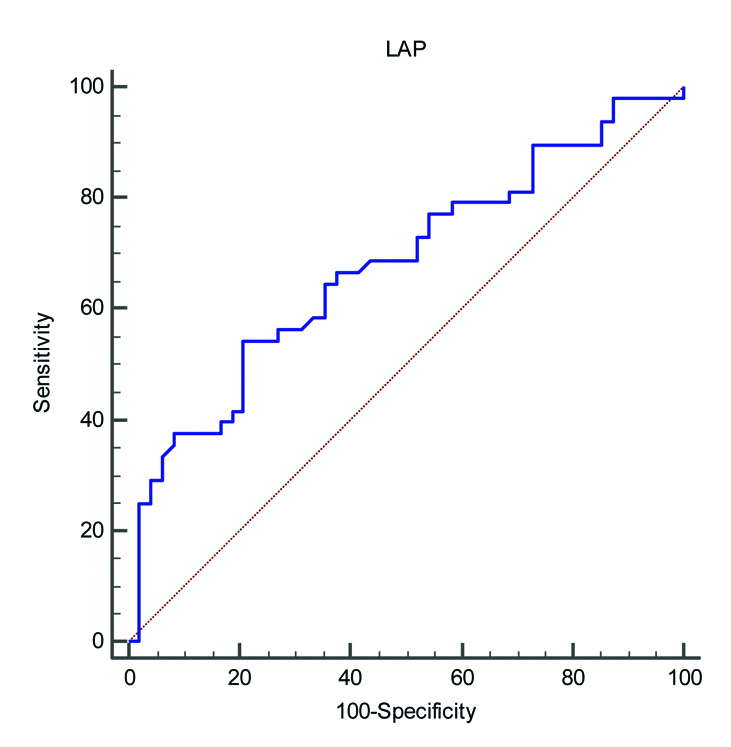
The area under ROC, 95% confidence interval, optimum cut off, sensitivity, specificity, Likelihood ratios (LR) and Predictive values (PV) for LAP to predict CVD risk.
| Area under the ROC curve (AUC) | 0.678 |
| Standard error | 0.0551 |
| 95% Confidence interval | 0.575 to 0.770 |
| Optimum cut-off | >52.845 |
| Criterion | Sensitivity | Specificity | +LR | -LR | +PV | -PV |
| >52.845 | 54.17 | 79.17 | 2.6 | 0.58 | 72.2 | 63.3 |
Discussion
There is an increased risk of developing CVD in women with PCOS. As PCOS occurs in women in the reproductive age group, early detection of those who are likely to contract CVD by a predictive marker allows for early interventions. PCOS is a metabolic condition associated with increased central adipose tissue as one of the main clinical manifestations [18,19]. Even with a normal body weight, women with PCOS have usually increased visceral adiposity [20,21]. Visceral obesity is associated with increased adipocytokine production, proinflammatory activity, hypertension, deranged lipid profile and IR, leading to increased risk of atherosclerosis and high mortality rates [22-24]. The assessment of visceral obesity is of utmost importance for the prevention of CVD and other metabolic complications in women with PCOS. Costly imaging studies for determining visceral obesity can be avoided if there is an easily applicable indicator for estimating visceral fat for the assessment of CVD risk in patients [25]. LAP is a low cost risk determining index which can be used to track PCOS women at risk of developing CVD.
Both the case and control group in this study was non-obese, but MetS was found significantly higher in PCOS women. PCOS women had a greater WC, low HDL level and some fitted the criteria of increased FPG and serum TG of NCEP ATP III definition so that out of the 48 cases, 16 were having metabolic syndrome. The youngest among PCOS group was 20-year-old and age ranges from 20 to 35 years. The phenotypic expression that brings these patients to healthcare system is gynaecological abnormalities in this age group and not cardio metabolic difficulties. Identifying cardiovascular risk factor early in this age group using LAP index may prove beneficial to them. LAP index has been shown to increase in MetS, type 2 Diabetes Mellitus [26] and hypertension [27]. Among PCOS women of this study, the mean TG concentration was 131.6±44.8 mg/dL, WC 93.6±7.6 cm and LAP index 54.5±24.0 (range of 10.30 to 110.06). The LAP index cut-off value for cardiovascular risk prediction obtained was >52.845 with a sensitivity of 54.17% and specificity of 79.17%. When compared to similar studies [10], present study showed higher mean LAP index values both in cases and controls which can be due to difference in ethnicities. This finding was in accordance with a study from India [28]. The authors compared LAP index in PCOS women and healthy women and the findings suggest that LAP index was significantly higher for PCOS women with MetS. The LAP index was proved as a valuable tool to predict cardiovascular risk was as it emerged out as an independent risk factor for CVD in multiple regression analysis. The study established correlation between LAP and cardiovascular risk factors in women with PCOS. This was in accordance with several studies which have shown that in PCOS women abnormal LAP values were associated with cardiovascular risk markers [29,30]. Another established risk factor for CVD is HDL cholesterol levels below the recommended limit, irrespective of LDL cholesterol values [31]. Similar observations were noted in the present study too. The significant correlation were found between LAP and Total Cholesterol, TG, HDL, LDL, in PCOS group. The same finding was observed by Mario FM et al., [29], whereas, a study by Rabab M et al., couldn’t establish any correlation [32]. The prevalence of MetS was higher in women with PCOS and LAP index was also high among these women. This findings were comparable with studies by Macut D et al., and Macut D et al., [33,34]. In a study by Ray L et al., LAP index was a better predictor of MetS comparedto BMI and WC in Indian population [28]. Due to its diagnostic accuracy, LAP is replacing the use of many clinical indicators for the assessment of lipid accumulation and is an imperative tool for diagnosis of cardiovascular and metabolic diseases in PCOS women.
Limitation(s)
Sample size was small and it was difficult to derive cut-off values as such. IR, which is an important CVD markers was not taken into consideration and its correlation with LAP index was not probed due to financial constraints.
Conclusion(s)
The study results showed that LAP index more than 52.85 can be considered as a risk factor for CVD in PCOS women. LAP may be more accessible and accurate tool for predicting CVD risk in PCOS women. This can be considered by further large scale, multicentre studies to determine LAP index cut-off values depending on ethnic difference, anthropometric characteristics and other associated diseases. Identifying high LAP index among PCOS women warrants need for immediate dietary and lifestyle modification to prevent future cardio metabolic risks. As LAP index utilises only WC and serum TG level it is easily calculated if the assay is made available in the primary healthcare system and it improves women healthcare especially in rural India. Imparting regular physical activity is one of the easiest ways to combat MetS and thereby preventing development of CVDs.
Values expressed as mean±SD. Student’s t-test was done.
*Expressed as number (Percentage). Chi-square test was employed; BMI: Body mass index; WC: Waist circumference; TG: Triglceride; HDL: High density lipopotein; LDL: Low density lipopotein; FBS; Fasting blood sugar; SBP: Systolic blood pressure; DBP: Diastolic blood pressure; LAP: Lipid accumulation product; p-value <0.05 significant
Chi-square test was done with significant
Values expressed as mean±SD. Student’s t-test was done. p-value <0.05 is considered as significant
p-value <0.05 is considered significant; **correlation is significant at the 0.01 level; *correlation is significant at the 0.05 level
Adjusted R square=0.979 standard error=3.19; F7,88=629.146; p<0.001