A seizure is a sudden and paroxysmal alteration in neurological function caused by the abnormal excessive activity of neurons [1]. Seizures can be categorised as either acute symptomatic or unprovoked. Acute symptomatic seizures occur due to an underlying systemic insult or a brain injury, while unprovoked seizures happen without any identifiable precipitating factors [1]. These unprovoked seizures are common neurological occurrences in children and can appear as isolated instances or recur, similar to epilepsy.
The incidence of single unprovoked seizures varies significantly, ranging from 23 to 64.1 per 100,000 people per year [2-4]. First Unprovoked Seizure (FUS) pose diagnostic challenges and raise concerns about aetiology and seizure recurrence. The use of EEG and neuroimaging in managing FUS is still a subject of discussion.
The EEG is a cost-effective tool crucial for managing FUS. It helps determine seizure onset, identify epilepsy syndromes, assess the need for MRI, evaluate the risk of seizure recurrence, guide anti-seizure medication choices and provide prognostic information. If initial EEG findings are negative, additional techniques like sleep deprivation, hyperventilation and photic stimulation can improve diagnostic yield [5].
Neuroimaging plays a vital role in identifying pathologies associated with unprovoked seizures [6]. The techniques include neurosonography, Computed Tomography (CT) and MRI. CT is rapid and suitable for emergencies, but it is less sensitive than MRI. MRI is crucial for identifying structural lesions, while it has drawbacks such as higher cost, limited availability and longer scanning time [7]. Advances in high-quality MRI and adherence to epilepsy protocols recommended by the International League Against Epilepsy (ILAE) have improved sensitivity [6]. Notably, a large-scale study involving 2,000 individuals found that 20% of patients with seizures had epilepsy-related pathology identified through MRI [8].
The American Academy of Neurology guidelines for FUS recommend routine EEG and urgent neuroimaging for children with postictal neurologic deficits and non urgent neuroimaging for unexplained cognitive or motor impairment, abnormal neurologic examination, non-specific abnormal EEGs and focal onset seizures [9]. The ILAE recommends diagnostic imaging for uncertain localisation-related new-onset epilepsy, unlikely symptomatic aetiology, or suspected epilepsy classification [6]. Indian guidelines recommend EEG for initial FUS evaluation and elective MRI under specified circumstances [10,11]. However, these decade-old guidelines need more research on the effectiveness of MRI and EEG in initial seizure assessments.
The FUS is a distressing event for patients, families and physicians. Recently, its impact has been recognised as being as disturbing as epilepsy. Most of the existing literature has often overlooked children with FUS, focusing more on those with confirmed epilepsy [12-16]. While EEG and MRI play crucial roles in the management of FUS, guidelines for neuroimaging remain unclear. There is a lack of data on the prevalence of clinically relevant abnormalities in neuroimaging that could benefit the management and follow-up of FUS, especially in the Indian context. The present study aimed to address these knowledge gaps and provide new insights into the potential utility of EEG and MRI in the management of FUS. It aimed to characterise the clinical profile of children with FUS, investigate the relationship between clinical, EEG and neuroimaging findings and explore the aetiology of FUS through neuroradiological and EEG patterns.
Materials and Methods
The present cross-sectional study was conducted from April 2021 to July 2022 (18 months) in the Paediatric Intensive Care Unit and Paediatric ward at Government TD Medical College, Alappuzha, Kerala, India. The study commenced after obtaining approval from the Institutional Ethics Committee (EC: 39/2021), Government TD Medical College, Alappuzha and securing written informed consent from the study subjects and their guardians.
Inclusion criteria: All children beyond the neonatal period up to 12 years who presented with First Unprovoked Seizure (FUS) and were admitted to the PICU and ward in the Department of Paediatrics, Government TD Medical College, Alappuzha, were included.
Exclusion criteria: Patients were excluded if an EEG and neuroimaging could not be done or if consent was not obtained.
Sample size calculation: The sample size was calculated based on the results of a previous study [17], which reported a Neuroimaging-EEG correlation in 58.10% of cases. Using the formula S=4 P Q/d2, where P=58.1, Q=41.9, the sample size was estimated to be 72. Consecutive sampling was employed.
Study Procedure
Patients were examined at admission, 24 hours post-admission and at discharge. A structured proforma collected information on variables such as age, gender, seizure type and duration, perinatal history, NICU admission details, developmental history, family history of epilepsy, parental consanguinity and clinical examination findings. Seizure duration was recorded to identify cases of status epilepticus, as defined by the International League Against Epilepsy [18]. Reasons for NICU admission encompassed prematurity, low birth weight, perinatal asphyxia, hyperbilirubinaemia, hypoglycaemia, infections and intraventricular haemorrhage. A structured developmental history interview was conducted and neurodevelopmental assessment was done using the Denver Developmental Screening Test II [19] to assess the developmental status. Seizure types were classified based on the International League Against Epilepsy’s 2017 expanded classification [9].
Patients fitting the inclusion criteria were sent for EEG and neuroimaging according to department protocols. An EEG was conducted within four days following the seizure, utilising the standard 10-20 international system for electrode placement. Each EEG session lasted 30 minutes and employed the Natus NicoletOne EEG system. Activation techniques, including intermittent photic stimulation and hyperventilation, were applied to all cooperative participants during the EEG recording. Additionally, a comprehensive epilepsy protocol MRI was performed either during hospitalisation or on an outpatient basis, using a 1.5 Tesla Siemens Magnetom Aera MRI scanner. The MRI sequences included Axial T1 Fluid-attenuated Inversion Recovery (FLAIR), T2 fs FLAIR, Coronal T2, Sagittal, Diffusion Weighted Imaging (DWI), Apparent Diffusion Coefficient (ADC), as well as Turbo Inversion Recovery (TIR) and Magnetisation Prepared Rapid Gradient Echo Imaging (MPRAGE) sequences. The EEG results were interpreted by a neurologist, while the neuroimaging findings were analysed by a radiologist. The final diagnosis was made after reviewing all investigations.
Statistical Analysis
The data analysis was performed using Microsoft Excel 2016 and Statistical Package for the Social Sciences (SPSS) software version 27.0. Quantitative variables were summarised using the mean and standard deviation, while qualitative variables were summarised using proportions and percentages. Significant associations between categorical variables were assessed using Pearson’s Chi-square test and Fisher’s-exact test as appropriate.
Results
The minimum age of participants in the study was two months, with a median age of 3.9 years. The majority of participants 23 (31.94%) were between 1 and 12 months old and the gender distribution was equal. The predominant seizure type was generalised onset (47, 65.28%). A family history of epilepsy was present in 25 (34.72%) cases. Neurological examinations revealed abnormalities in 14 (19.44%) participants, including hypertonia (n=5), hypertonia with spasticity (n=4), hypotonia (n=3) and facial nerve palsy (n=2) [Table/Fig-1].
Baseline characteristics of children with First Unprovoked Seizure (FUS).
| Characteristics | Results n (%) |
|---|
| Age | 1 month-12 months | 23 (31.94%) |
| 1-3 years | 13 (18.06%) |
| >3 to 6 years | 18 (25.00%) |
| >6 to 12 years | 18 (25.00%) |
| Gender | Male | 36 (50.00%) |
| Female | 36 (50.00%) |
| Semiology of seizures | Generalised onset | 47 (65.28%) |
| Focal onset | 25 (34.72%) |
| Status epilepticus | | 14 (19.44%) |
| Development delay | 12 (16.67%) |
| Prematurity | 14 (19.44%) |
| Low birth weight | 22 (30.56%) |
| Perinatal asphyxia | 6 (8.33%) |
| NICU admission | 25 (34.72%) |
| Family history of epilepsy | 25 (34.72%) |
| Parental consanguinity | 5 (6.94%) |
| Abnormal neurologic examination | 14 (19.44%) |
NICU: Neonatal intensive care unit
Among generalised onset seizures, generalised tonic-clonic seizures 13 (27.66%) were the most prevalent semiology. Focal tonic seizures 15 (60.00%) were the most common type among focal seizures [Table/Fig-2]. Focal onset seizures were primarily observed in the 3-6 years age group 11 (44.00%). Status epilepticus affected 14 (19.44%) participants, with 11 (78.58%) experiencing generalised onset seizures and 3 (21.43%) experiencing focal onset seizures with impaired awareness. There was no statistical significance in the prevalence of status epilepticus between generalised and focal seizures. During hospitalisation, 35 (48.61%) participants experienced seizure recurrence after 24 hours, with generalised onset seizures 26 (74.29%) being the most common to recur. No significant difference was found in EEG and MRI abnormalities between focal and generalised seizures [Table/Fig-3].
Types of generalised and focal onset seizures.
| Type of seizure | n (%) | Total |
|---|
| Types of generalised onset seizures | 47 |
| Tonic | 12 (25.53%) |
| Clonic | 5 (10.64%) |
| Atonic | 5 (10.64%) |
| Generalised tonic clonic | 13 (27.66%) |
| Myoclonic | 1 (2.13%) |
| Epileptic spasms | 9 (19.15%) |
| Atypical absence | 2 (4.26%) |
| Types of focal onset seizures | 25 |
| Tonic | 15 (60.00%) |
| Clonic | 7 (28.00%) |
| Epileptic spasms | 3 (12.00%) |
Comparison between characteristics of participants with generalised versus focal onset seizures.
| Characteristics | Number of participants | Generalised onset seizures | Focal onset seizures | p-value* |
|---|
| Age | 0.015 |
| 1 month-12 months | 23 | 20 (86.96%) | 3 (13.04%) |
| 1-3 years | 13 | 9 (69.23%) | 4 (30.77%) |
| >3 to 6 years | 18 | 7 (38.89%) | 11 (61.11%) |
| >6 to 12 years | 18 | 11(61.11%) | 7 (38.89%) |
| Gender | 0.217 |
| Male | 36 | 26 (72.22%) | 10 (27.78%) |
| Female | 36 | 21 (58.33%) | 15 (41.67%) |
| Status epilepticus | 14 | 11 (78.58%) | 3 (21.43%) | 0.244 |
| Family history of epilepsy | 25 | 15 (60.00%) | 10 (40.00%) | 0.470 |
| Abnormal neurologic examination | 14 | 8 (57.14%) | 6 (42.86%) | 0.230 |
| Seizure recurrence after 24 hours of first episode | 35 | 26 (74.29%) | 9 (25.71%) | 0.120 |
| Abnormal EEG | 25 | 14 (56.00%) | 11 (44.00%) | 0.200 |
| Abnormal MRI | 21 | 13 (61.90%) | 8 (38.10%) | 0.700 |
Data are expressed in N (%); *Significance is set at the p<0.05; Pearson’s Chi-square test was used to determine the statistical significance of the relationship; EEG: Electroencephalogram; MRI: Magnetic resonance imaging
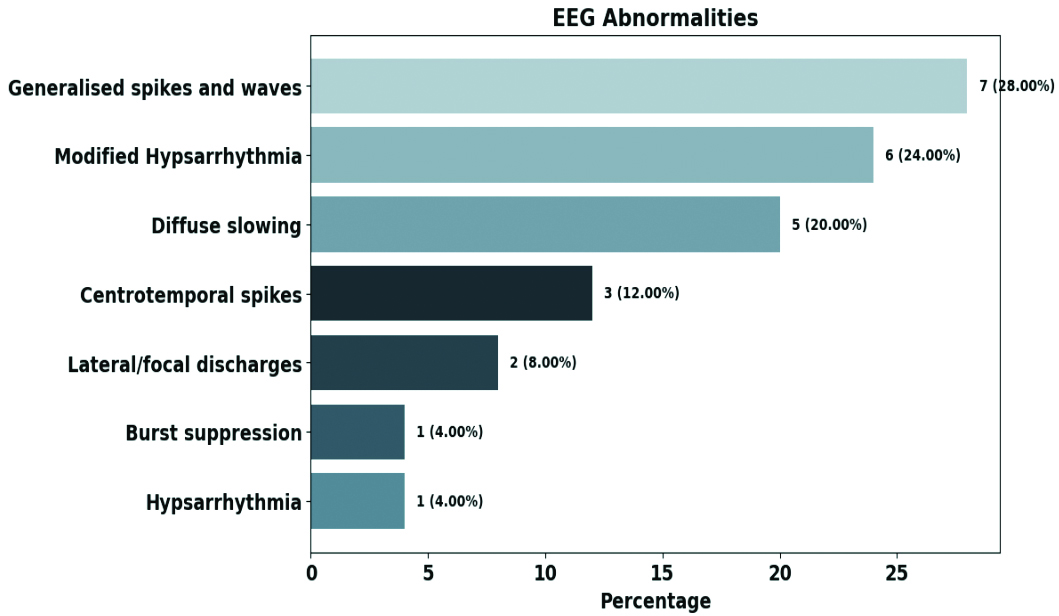
As depicted in [Table/Fig-4], Generalised spike-and-wave discharges 7 (28.00%) were the most common EEG finding, followed by modified hypsarrhythmia 6 (24.00%). EEG abnormalities were highest among infants 10 (40.00%), while centrotemporal spikes 3 (12.00%) were exclusively seen in the 3-6 years age group. Infants exhibited modified hypsarrhythmia, hypsarrhythmia and burst suppression patterns. Epileptic spasms were associated with abnormal EEG findings in 10 (83.33%) cases, with modified hypsarrhythmia (n=6) as the predominant pattern. Participants with hypsarrhythmia on EEG had the most abnormalities on MRI 6 (85.71%) [Table/Fig-5].
Spectrum of abnormalities in EEG.
Association between clinical characteristics and specific EEG abnormalities.
| Clinical characteristics | Generalised spikes and waves (n=7) | Lateral/focal discharges (n=2) | Centrotemporal spikes (n=3) | Diffuse slowing (n=5) | Hypsarrhythmia/Modified hypsarrhythmia (n=7) | Burst suppression (n=1) | Total |
|---|
| Age |
| 1 month-12 months | 1 (10.00%) | 1 (10.00%) | 0 | 1 (10.00%) | 6 (60.00%) | 1 (10.00%) | 10 |
| 1-3 years | 2 (66.67%) | 0 | 0 | 0 | 1 (33.33%) | 0 | 3 |
| >3 to 6 years | 3 (42.86 %) | 0 | 3 (42.86%) | 1 (14.29%) | 0 | 0 | 7 |
| >6 to 12 years | 1 (20.00%) | 1 (20.00%) | 0 | 3 (60.00%) | 0 | 0 | 5 |
| Most common semiology | GTCS (n=2)Epileptic spasms (n=2)Generalised tonic (n=1)Generalised atonic (n=1)Focal tonic (n=1) | Generalised tonic (n=1)Focal tonic (n=1) | Focal clonic (n=2)Focal tonic (n=1) | Focal tonic (n=2)GTCS (n=1)Generalised tonic (n=1)Generalised clonic (n=1) | Epileptic spasms (n=7) | Epileptic spasms (n=1) | 25 |
| Status epilepticus | 1 (20.00%) | 0 | 0 | 4 (80.00%) | 0 | 0 | 5 |
| Development delay | 2 (33.33%) | 0 | 1 (16.67%) | 0 | 3 (50.00%) | 0 | 6 |
| Prematurity | 1 (25.00%) | 0 | 0 | 0 | 3 (75.00%) | 0 | 4 |
| Perinatal asphyxia | 1 (16.67%) | 0 | 0 | 1 (16.67%) | 4 (66.67%) | 0 | 6 |
| Family history of epilepsy | 5 (55.56%) | 0 | 0 | 1 (11.11%) | 2 (22.22%) | 1 (11.11%) | 9 |
| Abnormal neurologic examination | 2 (20.00%) | 0 | 1 (10.0%) | 2 (20.00%) | 4 (40.00%) | 1 (10.00%) | 10 |
| Abnormal MRI | 4 (33.33%) | 0 | 1 (8.33%) | 1 (8.33%) | 6 (50.00%) | 0 | 12 |
Data are expressed in n (%); EEG: Electroencephalogram; GTCS: Generalised tonic clonic seizures; MRI: Magnetic resonance imaging
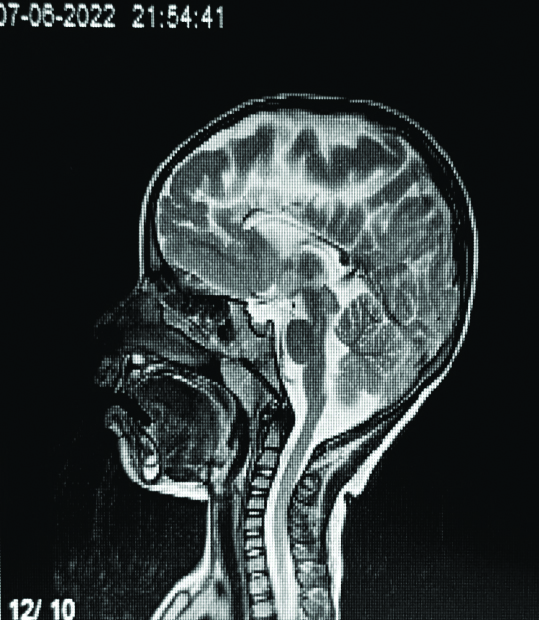
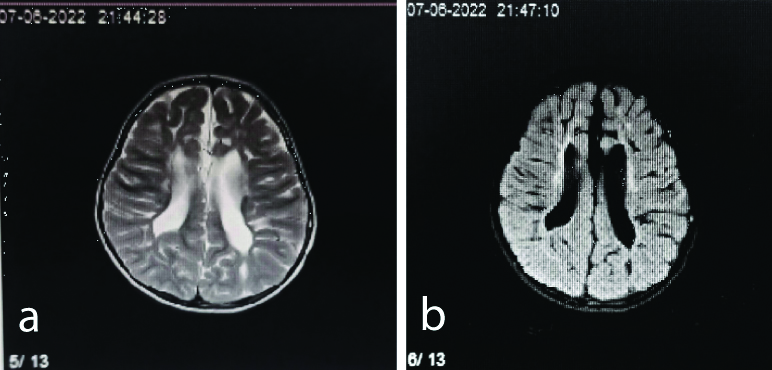
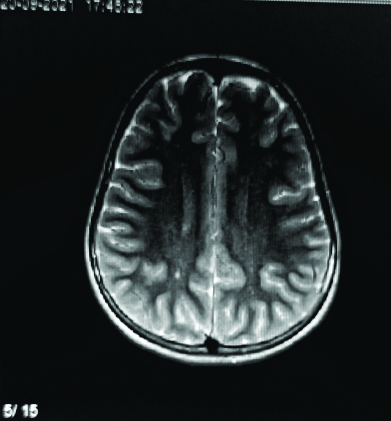
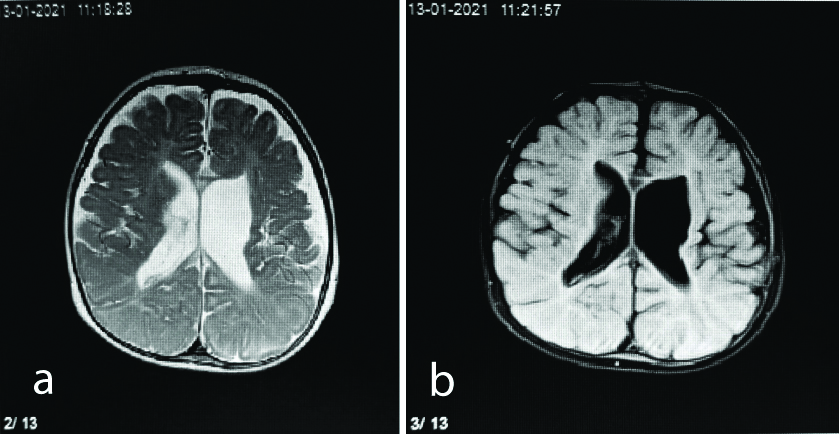
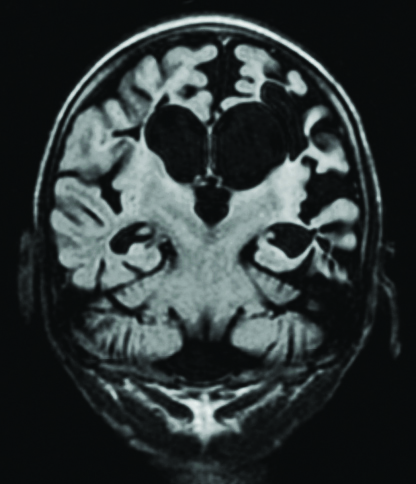
The common MRI abnormalities identified were hypoxic-ischaemic injury [Table/Fig-6,7 and 8] and cerebral dysgenesis, each occurring in seven cases. Focal gliosis or encephalomalacia were seen in five cases [Table/Fig-9,10 and 11]. MRI abnormalities were highest among infants 12 (57.14%). Epileptic spasms were associated with abnormal MRI findings in 7 (58.33%) cases. Among these, four cases were linked to cerebral dysgenesis. Additionally, there was one participant each with epileptic spasms associated with hypoxic-ischaemic injury, encephalomalacia and old bleed. Participants with cerebral dysgenesis on MRI exhibited the most abnormalities (n=5) on EEG, which included generalised spike-and-wave patterns and modified hypsarrhythmia [Table/Fig-12].
Sagittal T2-weighted sequence showing a thinned corpus callosum in a four-year-old female.
Axial T2 (a) and FLAIR (b) sequence showing T2 hyperintensities in periventricular white matter and loss of periventricular white matter in a three-year-old female.
Axial T2-weighted sequence displaying focal T2 hyperintensities in the right centrum semiovale in a 10-year-old female.
MRI abnormalities in the study population.
| MRI abnormalities | n (%) |
|---|
| Hypoxic-ischaemic injury | 7 (33.33%) |
| Focal gliosis/Encephalomalacia | 5 (23.81%) |
| Cerebral dysgenesis | 7 (33.33%) |
| Old bleed | 2 (9.52%) |
| Total | 21 (100%) |
Data are expressed in n (%); Total N=21; MRI: Magnetic resonance imaging
Axial T2 (a) and FLAIR (b) sequence showing dilated lateral ventricles with periventricular leukomalacia and volume loss in a six-month-old male.
Coronal T1-weighted sequence showing bilateral medial temporal sclerosis in a seven-year-old male.
Association between clinical characteristics and specific MRI abnormalities.
| Clinical characteristics | Hypoxic-ischaemic injury (n=7) | Focal gliosis/Encephalomalacia (n=5) | Cerebral dysgenesis(n=7) | Old bleed(n=2) | Total |
|---|
| Age |
| 1 month-12 months | 3 (25.00%) | 2 (16.67%) | 5 (41.67%) | 2 (16.67%) | 12 |
| 1-3 years | 1 (50.00%) | 0 | 1 (50.00%) | 0 | 2 |
| >3 to 6 years | 3 (60.00%) | 1 (20.00%) | 1 (20.00%) | 0 | 5 |
| >6 to 12 years | 0 | 2 (100.00%) | 0 | 0 | 2 |
| Most common semiology of seizures | Generalised tonic (n=2)Focal clonic (n=2)Generalised clonic (n=1)Atypical absence (n=1)Epileptic spasms (n=1) | Focal tonic (n=2)Generalised tonic (n=1)Myoclonic (n=1)Epileptic Spasms (n=1) | Epileptic spasms (n=4)Generalised tonic (n=1)GTCS (n=1)Focal clonic (n=1) | GTCS (n=1)Epileptic spasms (n=1) | 21 |
| Status epilepticus | 1 (33.33%) | 1 (33.33%) | 1 (33.33%) | 0 | 3 |
| Development delay | 3 (50.00%) | 0 | 3 (50.00%) | 0 | 6 |
| Prematurity | 3 (60.00%) | 0 | 2 (40.00%) | 0 | 5 |
| Perinatal asphyxia | 4 (80.00%) | 1 (20.00%) | 0 | 0 | 5 |
| Family history of epilepsy | 2 (33.33%) | 1 (16.67%) | 3 (50.00%) | 0 | 6 |
| Abnormal neurologic examination | 3 (37.50%) | 1 (12.50%) | 3 (37.50%) | 1 (12.50%) | 8 |
| Abnormal EEG | 4 (33.33%) | 2 (16.67%) | 5 (41.67%) | 1 (8.33%) | 12 |
Data are expressed in n (%); MRI: Magnetic resonance imaging; GTCS: Generalised tonic clonic seizures; EEG: Electroencephalogram
As shown in [Table/Fig-13], all six cases with perinatal asphyxia had abnormal EEG findings, featuring modified hypsarrhythmia, hypsarrhythmia, generalised spikes-and-waves and diffuse slowing. Four out of seven participants with hypoxic-ischaemic injury on MRI exhibited abnormal EEG patterns. The study found a statistically significant association between abnormal neurological examinations and abnormal EEG with the latter characterised by modified hypsarrhythmia, generalised spikes-and-waves, centrotemporal spikes, burst suppression and diffuse slowing. The study found a significant link between abnormal neurological examinations and MRI results, with 8 (57.14%) showing abnormalities on both. These abnormalities included hypoxic-ischaemic injury, cortical malformations, old bleed and encephalomalacia [Table/Fig-13]. Furthermore, a significant association was noted between NICU admissions and abnormal MRI findings, with 83.33% (n=5) of those with perinatal asphyxia having abnormal MRI results. Among these, MRI findings were consistent with hypoxic-ischaemic injury in four cases and cortical malformation in one case.
Association between clinical characteristics and abnormal EEG/MRI findings.
| Clinical characteristics | Abnormal EEGn (%) | Abnormal MRIn (%) | Total | p-value (EEG) | p-value (MRI) |
|---|
| Status epilepticus | 5 (35.71%) | 3 (21.43%) | 14 | 0.985 | 0.744 |
| Seizure recurrence after 24 hours of first episode | 10 (28.57%) | 11 (31.43%) | 35 | 0.419 | 0.885 |
| Development delay | 6 (50.00%) | 6 (50.00%) | 12 | 0.389 | 0.169 |
| Prematurity | 4 (28.57%) | 5 (35.71%) | 14 | 0.821 | 0.789 |
| NICU admissions | 9 (36.00%) | 12 (48.00%) | 25 | 0.979 | 0.016 |
| Perinatal asphyxia | 6 (100.00%) | 5 (83.33%) | 6 | 0.002 | 0.009 |
| Family history of epilepsy | 9 (36.00%) | 6 (24.00%) | 25 | 0.989 | 0.660 |
| Abnormal neurologic examination | 10 (71.43%) | 8 (57.14%) | 14 | 0.004 | 0.003 |
Data expressed as n (%); EEG: Electroencephalogram; MRI: Magnetic resonance imaging; Significance is set at the p<0.05; Fisher’s-exact test was used to determine the statistical significance of the relationship; NICU: Neonatal ICU
There was a significant association between EEG and MRI abnormalities in general and among generalised onset seizures, but not in focal onset seizures [Table/Fig-14,15].
Relationship between EEG and MRI findings in participants.
| MRI | EEG | p-value |
|---|
| Abnormal (n) | Normal (n) | Total (n) |
| Abnormal | 12 | 9 | 21 | 0.010 |
| Normal | 13 | 38 | 51 | |
| Total | 25 | 47 | 72 | |
Data are n; EEG: Electroencephalogram; MRI: Magnetic resonance imaging; Significance is set at p<0.05. Fisher’s-exact test was used to determine the statistical significance of the relationship
Relationship between EEG and MRI findings in participants with generalised seizures and focal seizures.
| Seizure type | MRI | EEG abnormal (n) | EEG normal (n) | Total (n) | p-value |
|---|
| Generalised | Abnormal (n) | 7 | 6 | 13 | 0.026 |
| Normal (n) | 7 | 27 | 34 |
| Total (n) | 14 | 33 | 47 |
| Focal | Abnormal (n) | 5 | 3 | 8 | 0.120 |
| Normal (n) | 6 | 11 | 17 |
| Total (n) | 11 | 14 | 25 |
Data are n; EEG: Electroencephalogram; MRI: Magnetic resonance imaging; Significance is set at p<0.05; Fisher’s-exact test was used to determine the statistical significance of the relationship
Discussion
Identifying connections between clinical characteristics, MRI abnormalities and abnormalities in EEG in children with FUS can enhance assessment and management strategies. However, research on these associations is limited. In the present study, the majority of subjects were infants, with 75% under six years old, aligning with Saravanan S et al., finding that two-thirds of FUS occur in children younger than six [20] and findings of the study by Das R et al., that 41.3% of cases are in this age group [17]. Generalised onset seizures were predominant, comprising 65.28% of cases, similar to other studies, where the incidence of generalised onset seizures ranged from 50% to 75% [17,20,21].
In the present study, 34.72% of participants had a family history of epilepsy, similar to Daoud AS et al., who reported a 31% incidence and considered it a significant risk factor for seizure recurrence [21]. Molla Mohammadi M et al., also reported a 29.2% incidence [22]. However, parental consanguinity was less common in this study, with only five cases, compared to 32% in the study by Daoud et al., [21].
In previous reports, the frequency of detecting epileptiform abnormalities on initial EEG in children with FUS ranged from 42% to 62% [17,23-26]. In this study, 34.72% of participants exhibited EEG abnormalities, which is lower than previous findings. This discrepancy may be due to the reduced sensitivity of standard 30-minute EEG recordings and the fact that hyperventilation and photic stimulation were only used on cooperative patients. Those with focal onset seizures displayed a higher incidence of EEG irregularities (44%, n=11) compared to generalised onset seizures (29.79%, n=14), consistent with findings by Shinnar S et al., [24].
Generalised spike-and-wave patterns were the predominant EEG abnormality, similar to the observations of Owolabi LF et al., and modified hypsarrhythmia was the second most frequent finding [26]. The study revealed a notable correlation between perinatal asphyxia, atypical neurological examination findings and EEG abnormalities. According to Owolabi LF et al., age, gender, family history and seizure frequency were indicators for predicting EEG abnormalities [26].
The MRI abnormalities were identified in 29.17% of patients, aligning with similar findings from Amirsalari S et al., (28.5%), Molla Mohammadi M et al., (29.2%), Doescher JS et al., (32%) and Kalnin AJ et al., (31%) [16,22,27,28], all of which advocate for neuroimaging in FUS. Indian studies by Bagla J et al., and Chandrakanta et al., observed a higher rate of neuroimaging findings (70.6%), often attributed to inflammatory granulomas [23,29]. Focal onset seizures had a higher rate of MRI abnormalities 8 (32%) compared to generalised onset seizures 13 (27.66%). Common MRI findings included hypoxic-ischaemic injury, cerebral dysgenesis and encephalomalacia, similar to the findings of Molla Mohammadi M et al., and Shinnar S et al., [22,24]. Apolot D et al., described hippocampal sclerosis, hypoxic-ischaemic injury and cortical malformations in MRI, while cortical abnormalities were the leading abnormality in the Doescher JS et al., study [14,27]. Dirik MA and Sanlidag B, and Amirsalari S et al., listed encephalomalacia, hydrocephalus and atrophy as the most common findings [13,16].
Children with a history of NICU stays, perinatal asphyxia and unusual neurological examinations had a significant association with abnormal MRI outcomes. Berg AT et al., found abnormal motor examinations to be the strongest predictor of imaging irregularities [30]. Dayan PS et al., identified high-risk medical history, focal seizures and abnormal neurologic examinations as risk factors for MRI abnormalities [31]. Amirsalari S et al., reported abnormal MRI findings linked to age, family history of epilepsy, dysmorphic appearance, abnormal physical examinations and abnormal EEG [16]. In the present research, EEGs yielded more abnormalities than MRIs, particularly in focal onset seizures (44% vs. 32%). For generalised onset seizures, both EEGs and MRIs had a comparable yield. The most common MRI abnormality associated with abnormal EEGs was cerebral dysgenesis, similar to the findings of Doescher JS et al., [27]. Dirik MA and Sanlidag B, reported encephalomalacia and cerebral atrophy as the most common MRI findings correlated with EEG abnormalities [13].
The EEG and MRI results were both abnormal in 12 patients (16.67%), while 52.78% had normal results for both tests. In 12.50% of cases, EEGs were normal, but MRIs were abnormal. A significant association was found between EEGs and MRI abnormalities, especially in generalised onset seizures, showing the likelihood of detecting abnormalities in neuroimaging when the EEG was abnormal. Dirik MA and Sanlidag B, found higher MRI abnormalities in participants with EEG abnormalities, particularly multifocal interictal discharges [13]. Elmi AM et al., reported both EEG and MRI abnormalities in 33.3% of participants but found no significant correlation [12]. This suggests that a normal EEG does not rule out MRI abnormalities, as supported by Doescher JS et al., who demonstrated that normal EEGs are not reliable predictors of normal MRIs [Table/Fig-16] [12,13,15-17,23,27].
Summary of studies assessing the relationship between MRI and EEG findings in children with FUS.
| S. No. | Author’s name and year | Place of study | No. of sub* | Objective | Parameters assessed | Conclusion |
|---|
| 1 | Doescher JS et al., [27], 2005 | United States | 181 | To explore the relationship between MRI and EEG findings. | Frequency of EEG and MRI abnormalities | Significant association between abnormal EEG and abnormal MRI.A normal EEG does not reliably predict a normal MRI. |
| 2 | Dirik MA and Sanlidag B, [13], 2018 | North Cyprus | 222 | To identify focal brain abnormalities in MRI linked to interictal discharges. | Seizure semiology, Incidence and abnormalities in EEG, Incidence and abnormalities in MRI | Interictal discharges can be unrelated to MRI findings. Focal discharges are not statistically concordant with MRI lesions. |
| 3 | Das R et al., [17], 2020 | Burdwan, India | 160 | To identify neuroimaging patterns, prevalence of MRI and CT abnormalities and their correlation with EEG results in children with FUS. | Seizure semiology, Incidence and abnormalities in EEG, Incidence and abnormalities in MRI | The study shows the superiority of MRI over CT and EEG. Radiological investigation is a necessity in an episode of FUS. |
| 4 | Bagla J et al., [23], 2021 | New Delhi, India | 170 | Compare clinically relevant information provided by EEG and MRI in FUS. | Clinical profile, Incidence and abnormalities in EEG, Incidence and abnormalities in MRI, Seizure recurrence on follow-up | High diagnostic yield on initial MRI. MRI brain is recommended as the initial investigation for evaluation of FUS. |
| 5 | Elmi AM et al., [12], 2024 | Mogadishu, Somalia | 102 | To identify the frequency of EEG and MRI abnormalities in paediatric epilepsy and their correlations. | Clinical data, EEG findings, MRI findings | No statistically significant relationship between EEG and MRI results. |
| 6 | Minh Xuan N et al., [15], 2020 | Ho Chi Minh, Vietnam | 112 | To assess MRI’s effectiveness and compare it with EEG’s diagnostic yield in children with partial epilepsy. | Clinical data, EEG findings, MRI finding | Normal EEG findings do not predict normal brain MRI in children with partial epilepsy. |
| 7 | Amirsalari S et al., [16], 2012 | Tehran, Iran | 200 | To correlate MRI findings with clinical and demographic data in children with epilepsy. | Clinical data, EEG abnormalities, MRI abnormalities | EEG to be used for confirmation of epilepsy and MRI to be performed for patients with abnormal physical exams, focal neurologic deficits or focal EEG abnormalities. |
| 8 | Present study | Kerala, India | 72 | To characterise clinical profile of children with FUS, relationship between clinical features and EEG/neuroimaging findings, Aetiology of FUS. | Clinical profile, Semiology of seizures, EEG abnormalities and incidence, MRI abnormalities and incidence | The study stresses using EEG and MRI together for assessing FUS effectively. EEG is preferred over MRI for FUS evaluation. Age, seizure type, perinatal asphyxia and neurological exam predicts EEG and MRI abnormalities. |
*Sub: Subjects; MRI: Magnetic resonance imaging; ECG: Electroencephalogram; CT: Computed tomography; FUS: First unprovoked seizure
In 23 (31.94%) of cases of FUS, a probable cause was identified. This included 10 (40%) of focal seizures and 26% of generalised seizures. Hypoxic-Ischaemic Encephalopathy was the leading cause, followed by structural anomalies. Notably, idiopathic epilepsy syndromes were identified in four patients, which included Self-limited Epilepsy with Centrotemporal Spikes (SeLECTS) and Self-limited Epilepsy with Autonomic Seizures (SeLEAS). Advanced neuroimaging and genetic techniques identified an aetiology in over 50% of patients, according to Symonds JD et al., [32].
Indian studies highlighted focal structural lesions like inflammatory granulomas, neurocysticercosis and tuberculomas as primary causes of FUS, recommending neuroimaging over EEG due to the high incidence of inflammatory granulomas in India [23,29]. The rarity of cysticercosis in Kerala may explain the different findings in this study [33].
The findings affirm EEG’s advantage over MRI in evaluating FUS, as endorsed by several Western and Indian guidelines. Age, perinatal asphyxia and abnormal neurological examinations were identified as strong predictors of EEG abnormalities. Similarly, these factors, along with NICU stays and EEG irregularities, predicted MRI abnormalities.
Limitation(s)
The study had important limitations to consider when interpreting the findings. Possible sampling bias due to consecutive sampling may limit generalisability. Additionally, the standard 30-minute EEG recordings may reduce the detection yield. The absence of a longitudinal study design restricts the ability to track participants’ clinical status over time, which is crucial for understanding the progression and management of FUS.
Conclusion(s)
The study emphasises the importance of a comprehensive evaluation of FUS using both EEG and MRI for effective assessment and management strategies. EEG remains advantageous over MRI, consistent with guidelines and EEG abnormalities are a good predictor of MRI abnormalities. However, a normal EEG does not guarantee a normal MRI. The study also underscores the significance of age, seizure semiology, perinatal asphyxia and neurological examination findings in predicting EEG and MRI abnormalities in children with FUS. Paediatricians and neurologists should integrate clinical features, EEG and MRI findings to optimise assessment and management, leading to improved patient outcomes.
NICU: Neonatal intensive care unit
Data are expressed in N (%); *Significance is set at the p<0.05; Pearson’s Chi-square test was used to determine the statistical significance of the relationship; EEG: Electroencephalogram; MRI: Magnetic resonance imaging
Data are expressed in n (%); EEG: Electroencephalogram; GTCS: Generalised tonic clonic seizures; MRI: Magnetic resonance imaging
Data are expressed in n (%); Total N=21; MRI: Magnetic resonance imaging
Data are expressed in n (%); MRI: Magnetic resonance imaging; GTCS: Generalised tonic clonic seizures; EEG: Electroencephalogram
Data expressed as n (%); EEG: Electroencephalogram; MRI: Magnetic resonance imaging; Significance is set at the p<0.05; Fisher’s-exact test was used to determine the statistical significance of the relationship; NICU: Neonatal ICU
Data are n; EEG: Electroencephalogram; MRI: Magnetic resonance imaging; Significance is set at p<0.05. Fisher’s-exact test was used to determine the statistical significance of the relationship
Data are n; EEG: Electroencephalogram; MRI: Magnetic resonance imaging; Significance is set at p<0.05; Fisher’s-exact test was used to determine the statistical significance of the relationship
*Sub: Subjects; MRI: Magnetic resonance imaging; ECG: Electroencephalogram; CT: Computed tomography; FUS: First unprovoked seizure