Ventilatory function tests like PEFR provide a better understanding of the changes in the lungs from a diagnostic viewpoint. The PEFR has been defined by the European Respiratory Society as the maximal flow which is achieved during the expiration which is delivered with maximal force, starting from the level of maximal lung inflation, following the maximal inspiration which was expressed in litres/min [1, 2]. This lung function test is useful for screening and monitoring the severity of asthma in a community, especially when the prevalence of asthma and asthma related hospital admissions are rising [3].
It is well known that age, height and weight are the main factors which affect the Peak Expiratory Flow Rate (PEFR), the Forced Expiratory Volume in the first second (FEV1) and the Forced Vital Capacity (FVC) [4]. There is a good correlation between the PEFR and the FEV1. The coefficient of correlation between the PEFR and the FEV1 is 0.516. The PEFR can be easily measured by using a peak flow meter which is easily portable and cheap, whereas the FEV1 can only be measured by using a spirometer [5]. Thus, the FEV1 measurements could be substituted by the easier PEFR measurements. The normal range of the PEFR is related to factors such as age, height, weight, gender, race and the environmental conditions [6–8]. This study was done to show the variations of the PEFR with the age, height, weight, Body Surface Area (BSA) and the Body Mass Index (BMI) in healthy women of the Malwa region of Punjab, who were living within similar socio-cultural environments and were engaged in similar forms of physical activities.
MATERIAL AND METHODS
A sample of 300 females was selected randomly from among the healthy women of the Malwa region of Punjab and their PEFRs were determined by using a mini Wright’s peak flow meter which was manufactured by Clement Clarke International Limited. The study was done over a period of one year, from March 2011 to March 2012.Their ages ranged from 20-50 years. The subjects were interviewed and thorough general and systemic examinations were done for every case. The information on their families, socio-economic conditions, habits, literacy and the respiratory symptoms which they experienced and their frequencies, the histories of their medications etc. was collected. The women who gave a history of wheezing and cardiovascular or respiratory diseases were excluded from study. Informed consents were taken from all the subjects and an ethical clearance was obtained from the institution. All the subjects were non-smokers and non-athletes who were involved in similar daily activities. The ages of the subjects were recorded in years. Their standing heights were measured in centimetres by making the subjects to stand barefoot on the floor against the wall, with their heels slightly separated and their buttocks in contact with the wall. Their weights were measured in kilograms, with the subjects standing on a portable weighing machine without wearing shoes. The BSA was calculated by using the Dubois formula [9]. BSA (m2) = 0.007184 x Weight0.425 x Height0.725. The BMI was calculated as BMI (kgs/m2) = body weight/height2. The PEFR was measured in litres/minute.
The PEFR was measured when the subjects were comfortably seated. The instructions and the methods of carrying out the test were given/demonstrated to the subjects. Each subject made 3 PEFR manoeuvres and the highest value was recorded, since this parameter requires maximal effort. At the end of all the measurements, the subjects were grouped according to the ranges in the age, height, weight, BSA and the BMI. The results were expressed as mean PEFR ± standard deviation (mean ± SD), while the Student’s ‘t’ test was used to determine the difference between the means. A p-value of less than or equal to 0.05 was taken as statistically significant. Younger females (< 20 years) were not included in the study, as extremely few young females satisfied the selection criteria for participation in the study, especially as regards their availability and capacity to cooperate adequately.
RESULTS
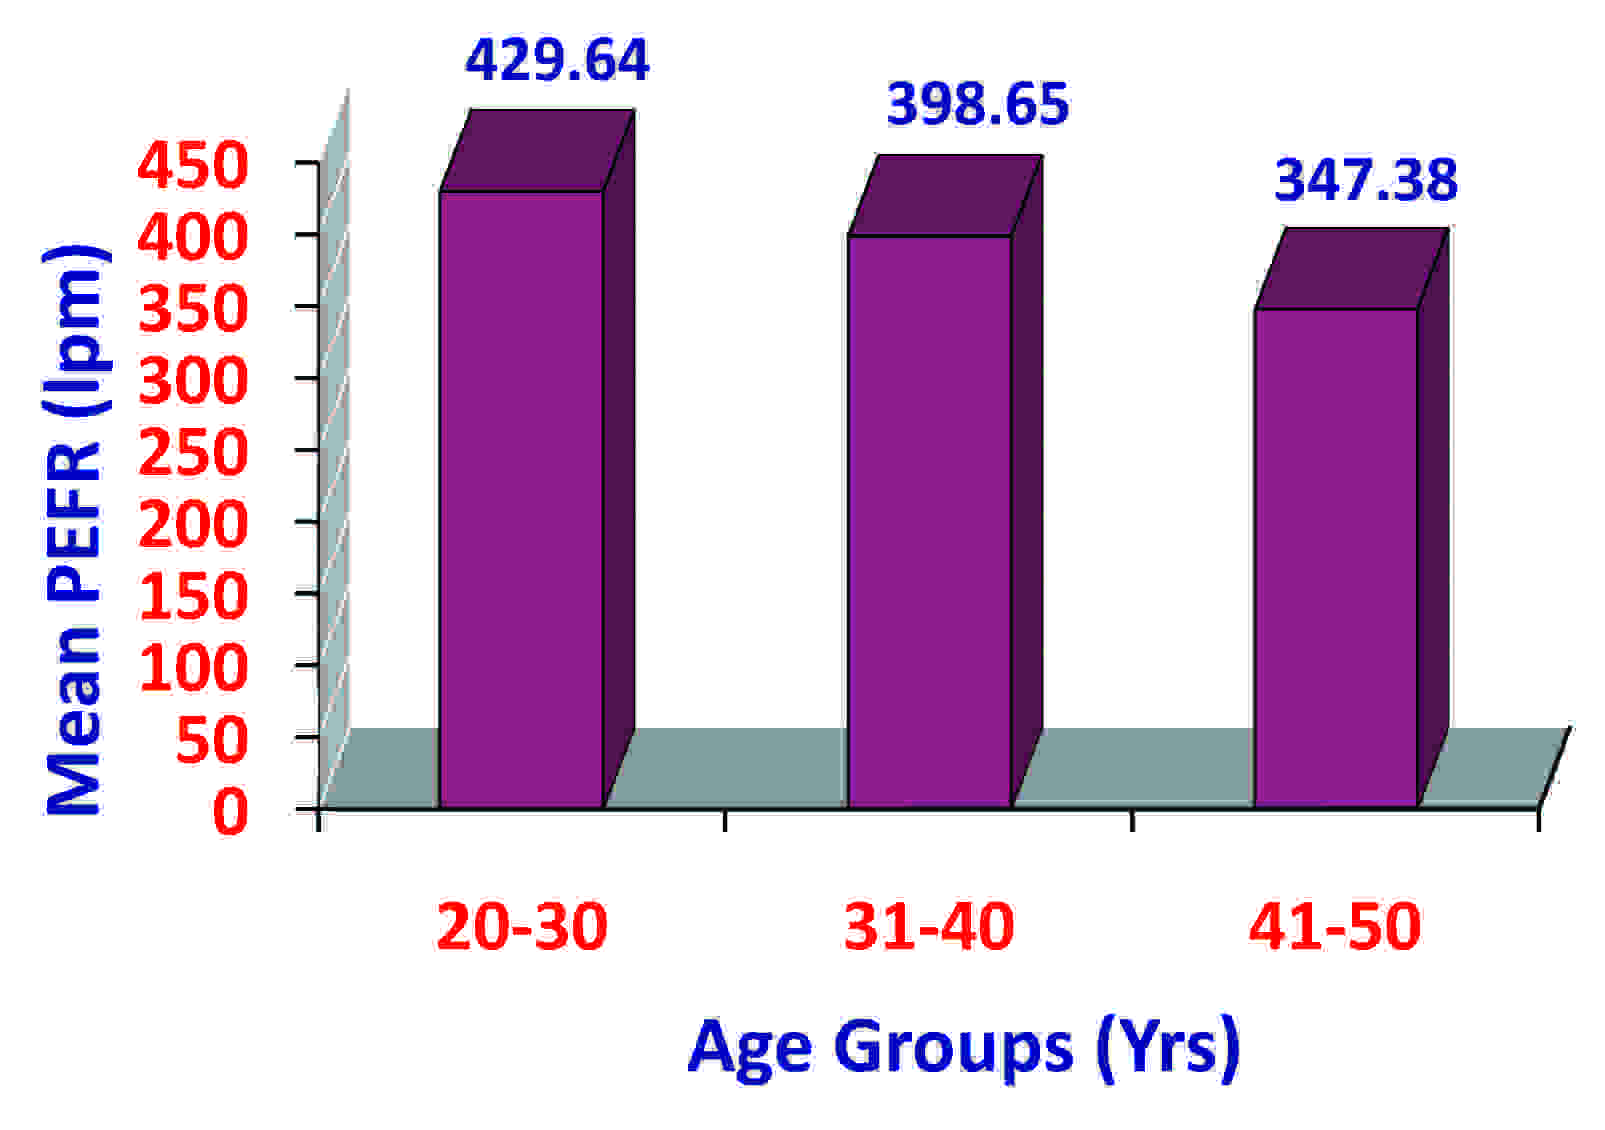
The present study was conducted on 300 healthy women who were in the age group of 20-50 years, who were from the Malwa region of Punjab. The mean PEFR for the women was 395.87 ± 56.81 litres/minute. The mean PEFR decreased with an increase in the age in the study subjects. The PEFR in the age group of 20-30 years (429.64 ± 48.65) was less than that in the age group of 41-50 years (347.38 ± 37.68), which was statistically highly significant (p < 0.005).
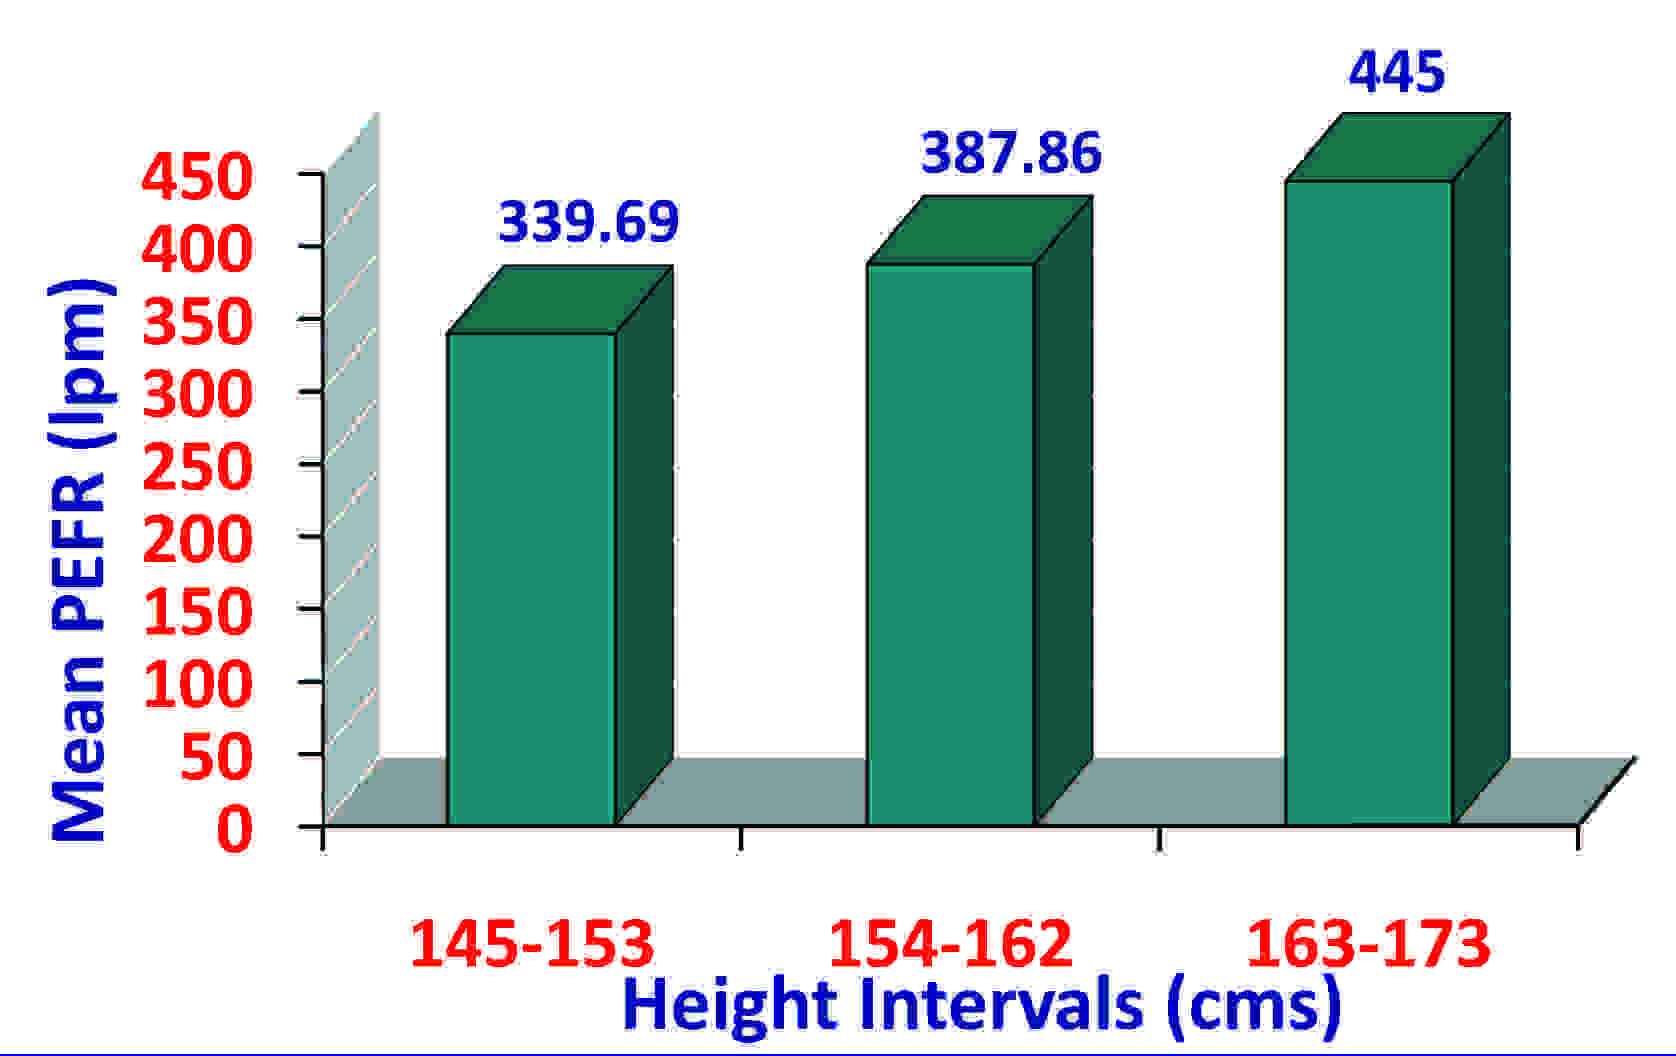
The PEFR in the height range of 145-153 cm (339.69 ± 38.98) was significantly less than that in the height range of 163-173 cm (445 ± 37.76) (p< 0.005). The PEFR also increased with the BSA in the study subjects. However, a correlation of the PEFR with the weight and the BMI was lower. The results have been shown in [Table/Fig-1,2,3,4,5,6,7,8,9,10,11,12,13,14,15&16].
Mean and SD of PEFR in Study Subjects
| Study subjects | Range of PEFR | Mean ±SD of PEFR (in litres per minute) |
|---|
| 270–510 | 395.87 ± 56.81 |
Comparison of Mean and SD Of PEFR in Study Subjects According to Age Groups
| Group no. | Age (in yrs) | No. of subjects | Mean ± SD of PEFR (in lpm) |
|---|
| I | 20–30 | 112 | 429.64 ± 48.65 |
| II | 31–40 | 104 | 398.65 ± 50.37 |
| III | 41–50 | 84 | 347.38 ± 37.68 |
Bar Diagram Showing Mean Pefr in Study Subjects According to Age Groups
| Comparison | ‘t’ | ‘p’ | Significance |
|---|
| I and II | 4.598 | < 0.005 | HS |
| I and III | 12.87 | < 0.005 | HS |
| II and III | 7.74 | < 0.005 | HS |
Comparison of Mean and SD of PEFR in Study Subjects According to Height Intervals
| Group no. | Height (in cm) | No. of subjects | Mean ± SD of PEFR (in lpm) |
|---|
| I | 145–153 | 64 | 339.69 ± 38.98 |
| II | 154–162 | 140 | 387.86 ± 45.90 |
| III | 163–173 | 96 | 445 ± 37.76 |
Bar Diagram Showing Mean Pefr in Study Subects According to Height Intervals
| Comparison | ‘t’ | ‘p’ | Significance |
|---|
| I and II | –7.28 | < 0.005 | HS |
| I and III | –17.06 | < 0.005 | HS |
| II and III | –10.08 | < 0.005 | HS |
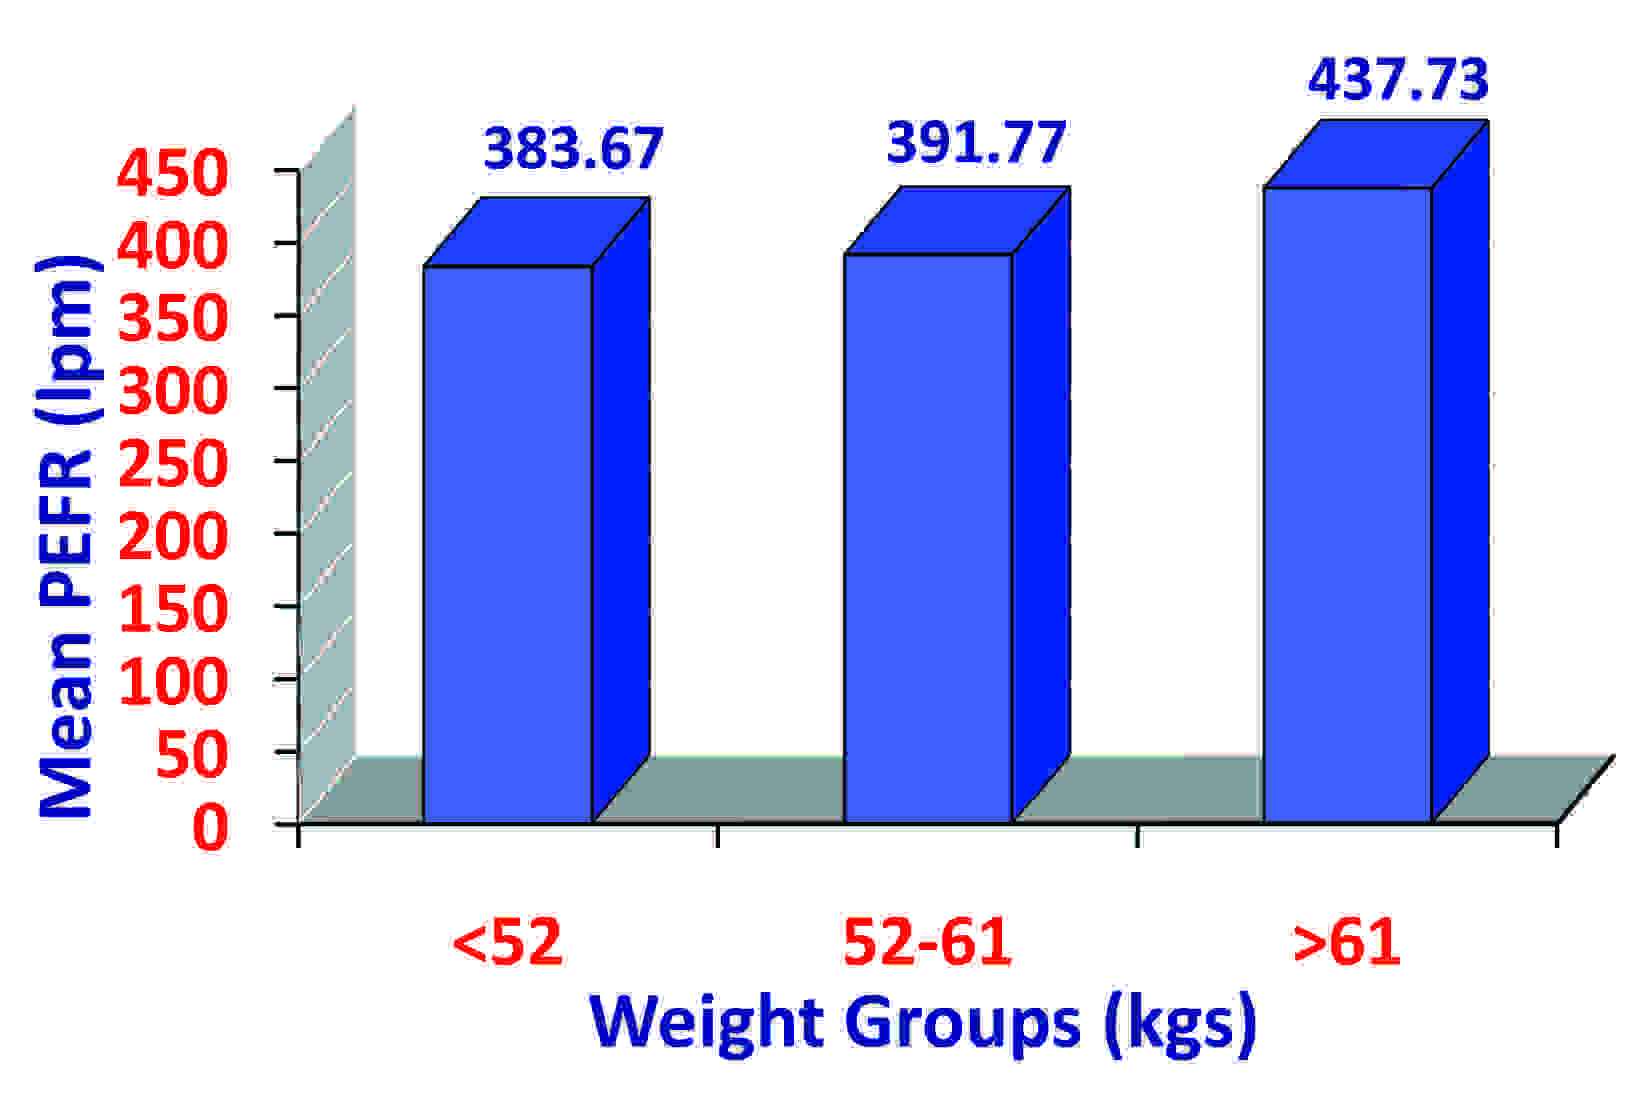
Comparison of Mean and SD of PEFR in Study Subjects According to Weight Groups
| Group no. | Weight (in kgs) | No. of subjects | Mean and SD of PEFR (in lpm) |
|---|
| I | < 52 | 98 | 383.67 ± 51.63 |
| II | 52–61 | 158 | 391.77 ± 60.02 |
| III | >62 | 44 | 437.73 ± 34.36 |
Bar Diagram Showing Mean Pefr in Study Subjects According to Weight Groups
| Comparison | ‘t’ | ‘p’ | Significance |
|---|
| I and II | –1.11 | > 0.05 | NS |
| I and III | –6.34 | < 0.005 | HS |
| II and III | –4.86 | < 0.005 | HS |
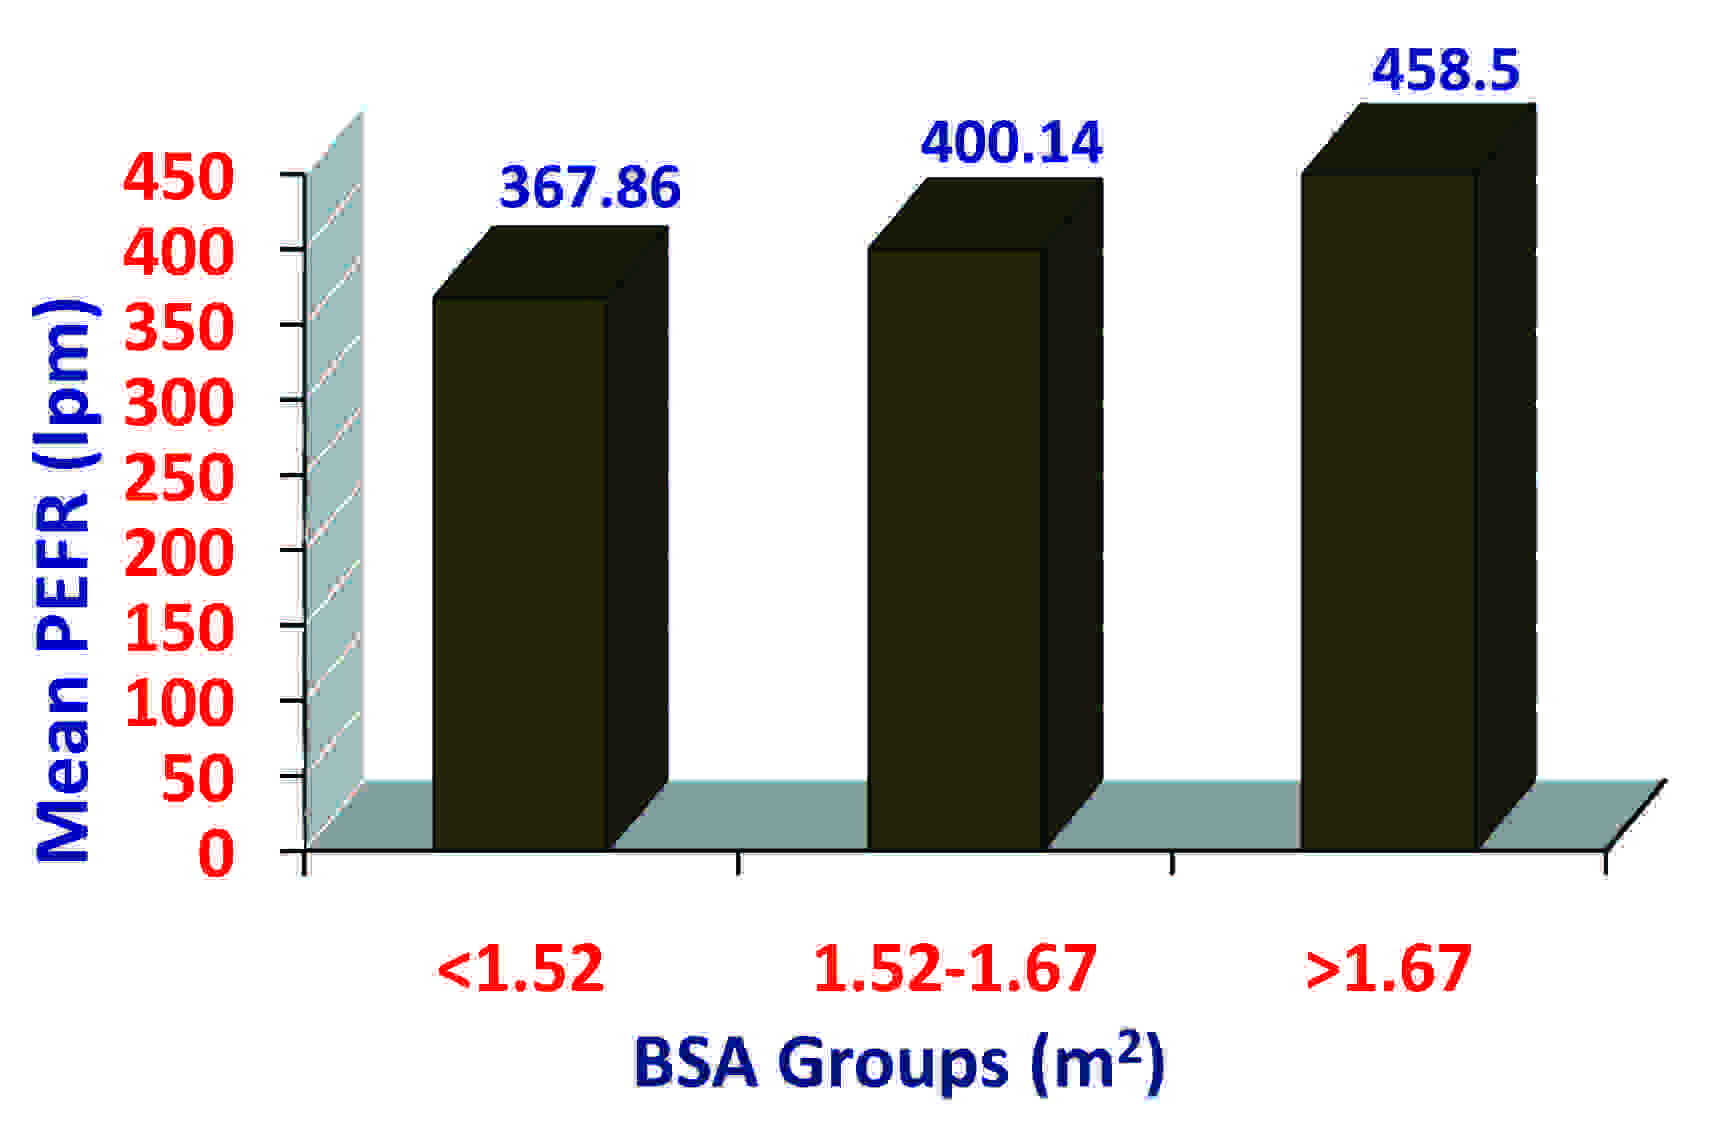
Comparison of Mean and SD of PEFR In Study Subjects According to Body Surface Area Groups
| Group no. | BSA | No. of subjects | Mean and SD of PEFR (in lpm) |
|---|
| I | < 1.52 | 112 | 367.86 ± 50.04 |
| II | 1.52–1.67 | 148 | 400.14 ± 52.28 |
| III | >1.67 | 40 | 458.50 ± 32.33 |
Bar Diagram Showing Mean Pefr in Study Subjects According to Body Surface Area Groups
| Comparison | ‘t’ | ‘p’ | Significance |
|---|
| I and II | –5.02 | <0.005 | HS |
| I and III | –10.68 | <0.005 | HS |
| II and III | –6.71 | >0.005 | HS |
Comparison of Mean and SD of PEFR in Study Subjects According to Body Mass Index Groups
| Group no. | BMI (in kgs /m2) | No. of subjects | Mean ± SD of PEFR (in lpm) |
|---|
| I | 15.42–20.64 | 120 | 402 ± 51.97 |
| II | 20.65–25.87 | 156 | 395.77 ± 59.73 |
| III | >25.87 | 24 | 365.83 ± 55.34 |
Bar Diagram Showing Mean Pefr in Study Subjects According to Body Mass Index Groups

| Comparison | ‘t’ | ‘p’ | Significance |
|---|
| I and II | 0.91 | > 0.05 | NS |
| I and III | 3.08 | < 0.005 | HS |
| II and III | 2.31 | < 0.05 | S |
DISCUSSION
This study was conducted on 300 healthy women who were aged 20-50 years, who were from the Malwa region of Punjab. The influences of age, height, weight, BSA and BMI on the PEFR of these women were studied.
The PEFR and age: This study showed that the PEFR decreased with an increase in age, as shown in [Table/Fig-2&3]. This correlation was found to be negative and the results were found to be statistically highly significant (p< 0.005), as shown in [Table/Fig-4]. This was in agreement with the reports of other investigators [10–13]. The decrease in the PEFR with an increase in age was probably because this variable was dependent on the expiratory effort and the elastic recoil of the lungs and the airway size, factors which are known to reduce with advancing age.
The PEFR and height: There was a positive correlation of the PEFR with height in the study subjects, as shown in [Table/Fig-5&6]. The results were found to be statistically highly significant (p<0.005), as shown in [Table/Fig-7]. This showed that there was an increase in the PEFRs of the study subjects with an increase in their heights. This observation was consistent with the findings of the studies which were conducted by other authors [7,13–15]. This was probably because of the greater chest volume in the taller subjects. The growth of the airway passages and the expiratory muscle effort also increase with an increase in the height.
The PEFR and weight: The PEFR was found to be positively correlated with the weight, as shown in [Table/Fig-8&9]. This observation was consistent with the reports of other authors [16]. This was found to be statistically highly significant (p<0.005) on comparing group I with group III and group II with group III, as shown in [Table/Fig-10]. A statistically non-significant difference was seen on comparing group I with group II.
The PEFR and BSA: The PEFR was found to be positively correlated with the BSA, which was found to be highly significant (p<0.005), as shown in [Table/Fig-11,12&13]. So, this study showed that there was an increase in the PEFRs of the study subjects with an increase in their BSAs and this observation was consistent with those of the studies which were conducted by other investigators [13,14].
The PEFR and BMI: The PEFR was found to be negatively correlated with the BMI in the study subjects, as shown in [Table/Fig-14&15]. There was a decrease in the PEFR with an increase in the BMI. However, the correlation of the PEFR with the BMI was non-significant (p>0.05), as shown in [Table/Fig-16]. This observation was consistent with those of other studies [17].
In conclusion, this study has generated preliminary reference values of the PEFR for the women of the Malwa region of Punjab.
CONCLUSION
The normative values of the PEFR for the women of the Malwa region of Punjab have been established. The effects of various factors like age, height, weight, BSA and BMI on the PEFR values have also been discussed in this study. Hence, it was concluded that the PEFR increases with an increase in age, height, weight and BSA, but that decreases with an increase in the BMI.