Diabetes mellitus is characterised by hyperglycemia together with biochemical alterations of glucose and lipid metabolism [1]. The goals of managing diabetes mellitus are to control the plasma glucose, oxidative stress and normalise disturbances in lipid metabolism. Drug management of diabetes without associated untoward effect has also remained a challenge for conventional medical practice. This has necessitated exploration and identification of medicinal plants with highly praised therapeutic efficacies in diabetes management as recommended by the WHO Expert Committee on diabetes mellitus [2]. Antilipidemic drug in diabetes is effective in reducing the risk of cardiovascular disease [3]. Recently, the search for appropriate hypoglycemic agents has been focused on plants used in traditional medicine [4]. Identification of natural products and its molecular mechanism by which it improves diabetic complications may open the new therapeutic target for the treatment of diabetes.
Material and Methods
Chemicals
S-Methyl L-cysteine, were procured from Sigma Chemicals Co. (St. Louis, MO, USA). All other chemicals were of analytical grade and were obtained from standard commercial suppliers.
Animals
Five months old male albino Wistar rats, weighing between 200 to 250 g, supplied by animal house, Jawaharlal Institute of Postgraduate Medical Education and Research (JIPMER), Puducherry, India, were housed in polypropylene cages with stainless steel grill. The rats were maintained at standard conditions with alternate cycles of 12-hour each (light & dark). The animal procedures were approved by the concerned authorities.
A total of 30 rats were selected for the study and randomized equally (6 rats) to all the study groups. The sample size was determined by convenience subjected to the concerned Ethics Committee approval.
Group 1: Control rats, received standard rat chow.
Group 2: Control - S-methyl-L-cysteine (100 mg/kg body weight/day/rat) in aqueous solution orally for 60 days.
Group 3: High Fructose Diet (HFD) rats were given 60% fructose mixed with standard rat chow.
Group 4: HFD+ S-methyl-L-cysteine (100 mg/kg body weight/day/rat) in aqueous solution orally for 60 days [6].
Group 5: HFD+ metformin (50mg/kg body weight/day/rat) in aqueous solution orally for 60 days [7].
Biochemical analysis
The plasma glucose, lipid profile and liver function test (AST and ALT) were estimated using ready kits (Agappe Diagnostics, Kerala, India) adapted for fully automated clinical chemistry analyser (Olymbus AU400, USA) according to the manufacturer’s instructions. VLDL cholesterol and LDL cholesterol were calculated using the Freidewald formula [8]. The total antioxidant status was measured by FRAP method [9].
Statistical Analysis
All values were expressed as mean ± S.D. Differences between the groups were assessed using one way analysis of variance with (ANOVA) with Tukey post hoc test. Complete statistical analysis was carried out using SPSS version 19.0.
Results
[Table/Fig-1] shows the changes in total body weight and organ weights of control and experimental groups. In HFD-induced diabetic rats, the body weight and liver, kidney and adipose tissue weights were increased significantly when compared with control rats. Administration of SMC, as well as, metformin resulted in a significant reduction in body weight and tissue weights.
Effect of SMC on body weight, liver and kidney weight in experimental rats
| Groups | Body weight end of the study (gram) | Relative organ weights (gram) |
|---|
| Liver | Kidney | Adipose tissue |
|---|
| Control | 257 ±6.35 | 5.33 ± 0.6 | 1.38 ± 0.2 | 1.53 ± 0.4 |
| SMC+Con | 263 ± 2.53 | 5.5 ± 1.11 | 1.55 ± 0.19 | 2.23 ± 0.33 |
| HFD | 335 ± 4.10a,b,c | 10.45±1.24a,b,c | 2.23±0.23a,b,c | 6.3±0.94a,b,c |
| HFD+SMC | 267.17 ± 2.48 | 7.27±1.08 | 1.73±0.21 | 4±1.46 |
| HFD+Met | 268.17 ± 3.87 | 7.32±0.69 | 1.78±0.24 | 4.38±1.57 |
aSignificantly different with control, bSignificantly different with SMC, csignificantly different with HFD+metformin at 5% level of significant (p<0.05)
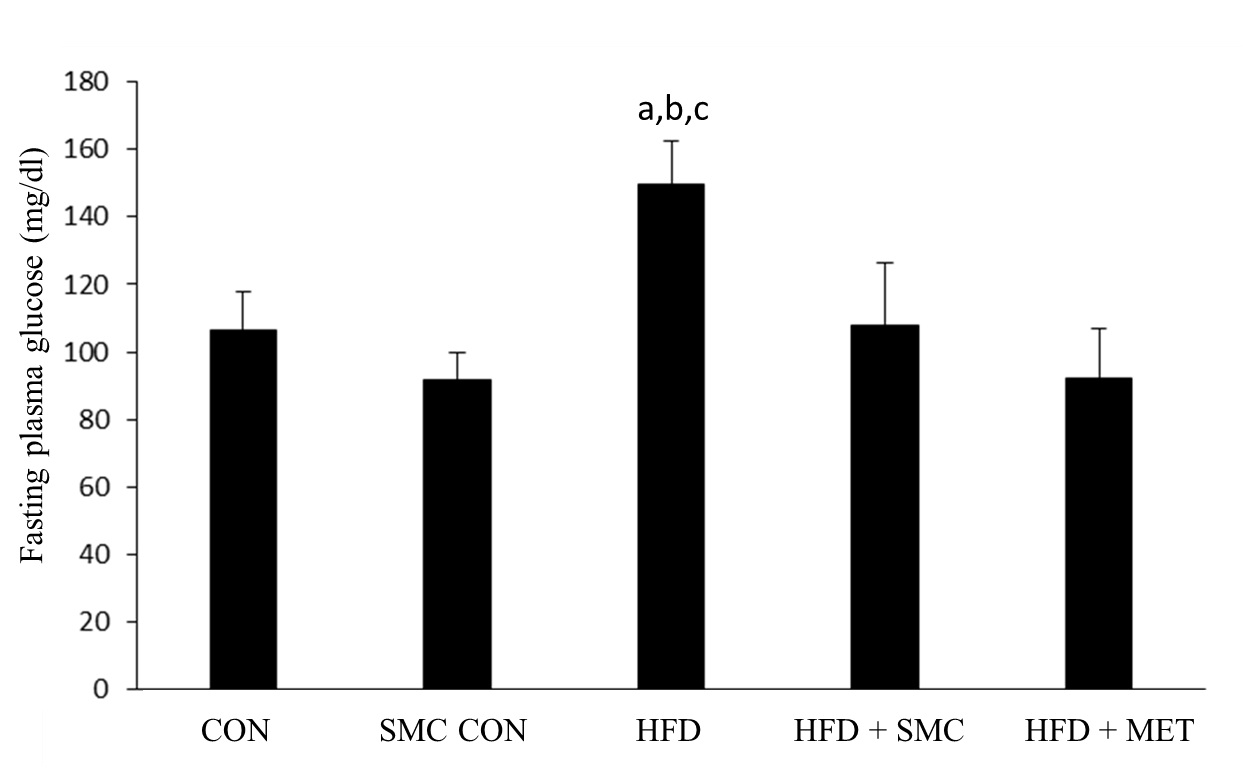
[Table/Fig-2] shows the level of plasma glucose in the control and experimental groups of rats. HFD rats showed a significant increase in plasma glucose compared with control rats. Following oral administration of SMC and metformin, plasma glucose level reverted back to those seen in control rats.
Effect of SMC on plasma glucose in control and experimental groups of rats
aSignificantly different with control, bSignificantly different with SMC, csignificantly different with HFD+metformin at 5% level of significant (p<0.05)

[Table/Fig-3] shows plasma lipid profile at basal level of control and experimental groups. There was no statistically significant difference in lipid profile among various groups at the beginning of the study.
Effect of SMC on plasma lipid profile in control and experimental animals at the beginning of the study
| Group | TC mg/dl | TG mg/dl | LDL mg/dl | VLDL mg/dl | HDL mg/dl |
|---|
| Control | 49.67±8 | 58.5±4.1 | 22.97±8.17 | 11.7±0.83 | 19.17±1.47 |
| SMC control | 52.83±6.85 | 60.67±10.1 | 19.7±4.68 | 12.13±2.01 | 20.83±2.6 |
| HFD | 51.5±6.9 | 60.33±7.1 | 19.1±7.0 | 12.07±1.43 | 20.33±2.16 |
| HFD + SMC | 52.83±5.42 | 64.17±8.82 | 20.8±8.2 | 12.83±1.56 | 19.5±1.87 |
| HFD + Met | 53.8±4.4 | 60±6.29 | 20.38±5.41 | 12±1.26 | 21.33±2.58 |
aSignificantly different with control, bSignificantly different with SMC, csignificantly different with HFD+metformin at 5% level of significant (p<0.05)
[Table/Fig-4] depicts effect of SMC on plasma lipid profile in control and experimental groups. The plasma levels of total cholesterol, triglyceride, LDL-cholesterol and VLDL-cholesterol levels were significantly (p <0.05) increased in HFD group along with statistically significant (p <0.05) reduction in HDL-cholesterol level in comparison with control group. HFD rats treated with SMC or metformin for 60 days, total cholesterol, triglyceride, LDL-cholesterol and VLDL-cholesterol levels were significantly reduced, whereas the HDL-cholesterol was significantly increased in comparison with the HFD group.
Effect of SMC on plasma lipid profile in control and experimental groups of rats at the end of the study
| Group | TC mg/dl | TG mg/dl | LDL mg/dl+ | VLDL mg/dl | HDL mg/dl |
|---|
| Control | 53.67±3.33 | 60.17±9.41 | 14.60±2.97 | 12.03±1.88 | 20±1.41 |
| SMC + control | 52.83±4.92 | 59±3.41 | 14.97±4.64 | 11.8±0.64 | 20.67±2.73 |
| HFD | 83.83±5.23a,b,c | 108±9.08a,b,c | 31.10±15.89a,b,c | 21.77±1.78a,b,c | 16±1.26a,b,c |
| HFD + SMC | 61.83±6.05 | 70.67±7.69 | 5.23±2.85 | 14.13±1.54 | 25±1.67 |
| HFD + Met | 59.50±3.27 | 69.33±14.38 | 11.45±6.17 | 13.87±2.88 | 25.83±3.66 |
aSignificantly different with control, bSignificantly different with SMC, csignificantly different with HFD+metformin at 5% level of significant (p<0.05)
[Table/Fig-5] shows AST and ALT activities in the plasma of the control and experimental groups. A significant elevation in AST and ALT activity in the HFD fed diabetic rats was observed compared with corresponding control rats. The administration of SMC and metformin significantly decreased AST and ALT activity in the plasma of diabetic rats.
Effect of SMC on AST and ALT in control and experimental rats
| Parameters | Control | SMC + control | HFD | HFD + SMC | HFD + Met |
|---|
| AST (IU/L) | 65.3±10 | 61±6.4 | 101±8.6a,b,c | 71.5±6.7 | 65.7±6.1 |
| ALT (IU/L) | 36.7±4.7 | 37.7±2.7 | 54.8±8.7a,b,c | 42.7±7.3 | 41±2.01 |
aSignificantly different with control, bSignificantly different with SMC, csignificantly different with HFD+metformin at 5% level of significant (p<0.05)
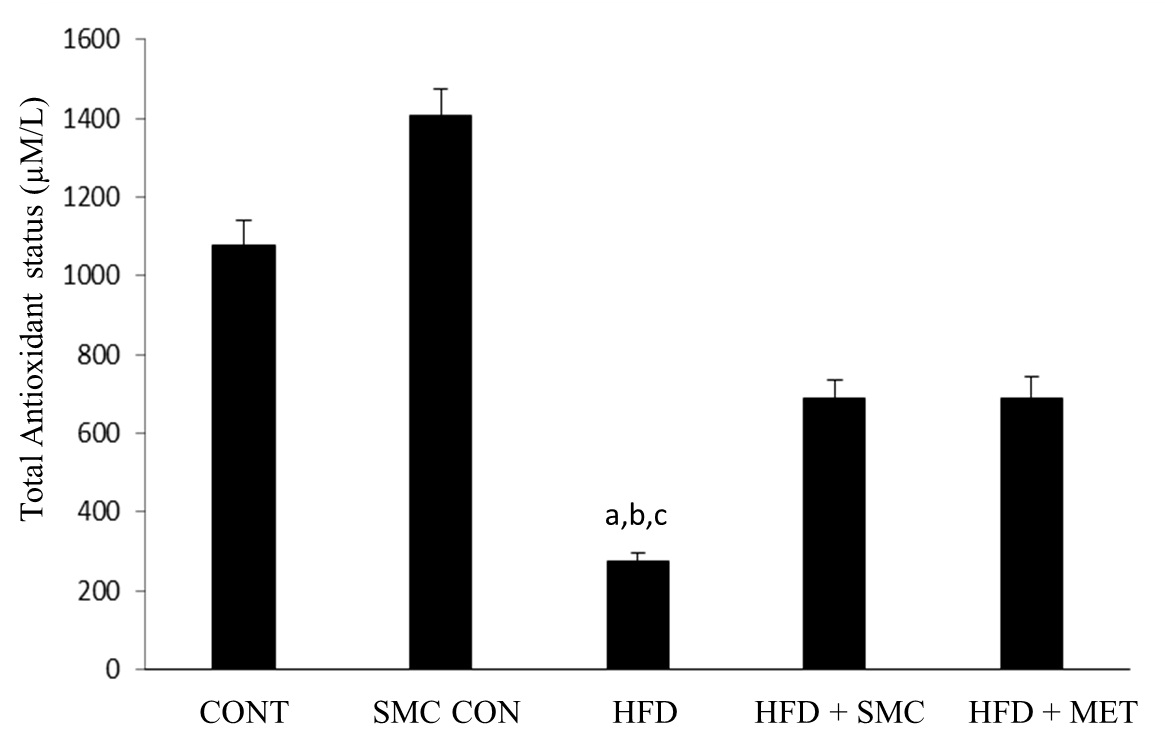
[Table/Fig-6] shows levels of total antioxidant status between the study groups at the end of the experiment. The level of TAS was significantly reduced in HFD group compared to other groups. A significant (p <0.05) increase in the level of TAS was observed on oral administration of SMC, as well as, metformin.
Total antioxidant status in control and experimental groups of rats
aSignificantly different with control, bSignificantly different with SMC, csignificantly different with HFD+metformin at 5% level of significant (p<0.05)

Discussion
Metabolic syndrome is a major health problem associated with complications, such as hypertension, hyperinsulinemia, insulin resistance and cardiovascular disorders. As one of the complications that followed diabetic hyperglycemia is dyslipidemia, the plasma lipid profile of rats was evaluated in this study. In this study, the rats fed with high fructose diet showed increased levels of total cholesterol, triglycerides, LDL, VLDL and decreased level of HDL. This increase in plasma lipids may be due to the increased fatty acid mobilization from adipose tissue. Since insulin has an inhibitory action on HMG-CoA reductase, the key enzyme in cholesterol biosynthesis [10], insulin deficiency or insulin resistance may be responsible for hyperlipidemia. Administration of SMC and/or metformin to high fructose induced diabetic rats significantly decreased the level of TC, LDL-C, VLDL-C and TG as compared to the increase in HDL-C. These improved effects clearly denote the antihyperlipidemic potential of SMC. Furthermore, we found that SMC may reduce the development of diet induced obesity as indicated by the decreased body weight and other organs such as liver, adipose and kidney. It could also be suggested that this antilipidemic activity of SMC pass through a decrease in intestinal cholesterol absorption or a decrease in the biosynthesis of cholesterol, specifically by decreasing the activity of HMG-CoA reductase in the liver.
The increase in ALT activity in diabetes is due to hepatocellular damage and is usually accompanied by an increase in ALT activity. Our studies with liver tissues of HFD induced rats indicate a trend towards increased activity of transaminases [11]. The reversal of ALT activity in SMC administrated rats towards near normalcy is evidence of the prevention of cellular and liver damage.
Oxidative stress, an imbalance in the oxidant and antioxidant ratio, plays a vital role in many metabolic disorders such as diabetes, hypertension and cardiovascular complications [12,13]. It is well-established that, intake of fructose rich diet causes the increased production of free radicals leading to oxidative stress. Studies in human and animals show that the antioxidant treatment significantly improves the stress induced complications in diabetes and other metabolic disorders [14]. High fructose diet induced oxidative stress secondary to high glucose level in blood [15] may have a role in lowering antioxidant status in diabetes as shown from our results for HFD control rats[16]. Also, modest improvements in glycemic control and plasma total cholesterol may reduce oxidative stress in diabetes as suggested by TAS in the HFD+SMC treated group. Lowering glycemia may have improved the ability of the rats to produce more antioxidants that removed excess free radicals. Our findings indicate that better antioxidant status in diabetic rats may accompany improved glycemic control, and potentially reduce the risks of developing oxidative stress and related diseases.
Conclusion
In conclusion, the administration of SMC to experimental diabetic rats decreases lipid profile and maintain antioxidant status and glucose at a normal level. Further, studies are in progress at molecular level to explicitly explain more about the mechanism of the antilipidemic activity of SMC.
aSignificantly different with control, bSignificantly different with SMC, csignificantly different with HFD+metformin at 5% level of significant (p<0.05)
aSignificantly different with control, bSignificantly different with SMC, csignificantly different with HFD+metformin at 5% level of significant (p<0.05)
aSignificantly different with control, bSignificantly different with SMC, csignificantly different with HFD+metformin at 5% level of significant (p<0.05)
aSignificantly different with control, bSignificantly different with SMC, csignificantly different with HFD+metformin at 5% level of significant (p<0.05)