Cancer cervix is the most common cancer in women in developing countries like India [1]. Several invitro & invivo studies [2–6] have linked insulin-like growth factor-I & -II (IGF-I & IGF-II) and insulin-like growth factor binding protein-3 (IGFBP-3) with pathogenesis of cervical cancer. IGF family is involved in regulation of many cellular functions, including growth, proliferation and differentiation [7]. IGF family consists of ligands (IGF-I & IGF-II), receptors {IGF-I receptor (IGF-IR), IGF-II receptor (IGF-IIR)} and binding proteins as IGFBP-3 [7]. Insulin also interacts with IGF-IR, albeit with a much weaker affinity than IGF-I [8]. Hepatic synthesis of IGF-I is dependent on growth hormone (GH) while that of IGF-II is independent of GH [9]. IGF-I and IGF-II are ligands that interact with separate receptors as Insulin receptor (IR), IGF-IR, IGF-II R [10]. IGF-I signals only through IGF-IR, while IGF-II signals through both IR and IGF-IR [8] as well as IGF-IIR which acts as a clearance receptor for circulating IGF-II rendering IGF-IIR a potential tumour suppressor molecule [9].
IGFBP-3 is synthesized in liver and carries 75% of serum IGF-I and IGF-II in a large trimeric complex [11]. IGFBP-3 can have IGF dependent and IGF independent functions i.e., mitogenic activity of IGFs are mediated by IGF-IR and this action is inhibited by their sequestration by soluble IGFBPs while IGFBP-3 can enhance IGF effects by presenting and slowly releasing IGF-I for receptor interactions [11]. IGF-II could potentially activate β-cell proliferation through IGF-IR and could play an important role in response to insulin resistance [12]. Obesity causes insulin resistance and IGF levels are increased in overnutrition [13]. Insulin stimulates the GH stimulated synthesis of IGF-I and IGFBP-3 by increasing levels of GH receptor [14].
Carcinoma cervix is a slowly evolving disease preceded by pre-cancerous stage, SIL. Though in-situ stage can be screened by cytological tests (Pap smear) and HPV DNA tests, due to low socioeconomic status in developing countries, these screening tests are limited to urban areas. There is an imminent need to identify subgroup of women at greater risk for development of cancer cervix. An appropriate simple, cost effective biomarker, not requiring highly skilled worker, could address this issue. To our knowledge no study has shown any correlation between C-peptide (a marker of pancreatic insulin secretion) with squamous intra-epithelial lesion (SIL).
In the current study an attempt has been made to evaluate correlation between SIL and various factors as IGF-I, IGF-II, IGFBP-3, C-Peptide and Body Mass Index (BMI). We have also tried to formulate an equation (Bio-effective Molar Ratio – BEMR) considering interplay between various factors in IGF system.
Materials and Methods
Sample population: The study was conducted in the Department of Biochemistry & Department of Obstetrics & Gynecology at Maulana Azad Medical College & associated LN Hospital, New Delhi on patients who came to attend gynecology OPD’s & cancer clinics during the period of 2004-2007. The study group consisted of 31 cases of histologically proven SIL {15 cases of LSIL (Low Grade SIL) and 16 cases of HSIL (High Grade SIL)} and 31 cytologically proven normal healthy controls. Controls were matched with respect to age, tobacco consumption, parity and menopausal status to the case patients. Pregnant females with SIL, cases of SIL with any concurrent medical illness, women who were on hormone replacement therapy or insulin treatment were excluded from study.
Procedure: The study was approved by institutional ethical committee and informed consent was taken for both cases and control. The study group was subjected to a structured questionnaire (regarding demographic, medical, lifestyle and reproductive information) & a detailed physical examination including gynecological examination was undertaken. After the interview, a 10 ml blood sample was collected in heparinized vial. Plasma was separated by centrifugation and stored at -80°C till analysis was done. IGF-I, IGF-II, IGFBP-3, and C-peptide were measured in plasma using commercially available ELISA kits (DRG diagnostics) in the units of ng/ml. Solid phase ELISA for IGF-I, IGF-II and C-peptide was based on the principle of competitive binding while that for IGFBP-3 on non competitive binding [15]. Height and weight of subjects was measured for calculating BMI in the units of kg/m2. Measured height was collected without shoes to the nearest 0.1 cm. Duplicate serum aliquots were analysed for each subject and the average was used for statistical analysis. The coefficients of variation (CV) for the duplicates were less than 10% for all markers, and intra-assay and inter-assay precision for CV ranges were 5.9–6.3%, 3.7-6.8%, 4.2–6.7% and 5.4-6.5% for IGF-I, IGF-II, IGFBP3 and C-peptide respectively.
Statistical Analysis
Statistical analysis was done using SPSS & Microsoft excel software. The data was analysed for normalcy using Shapiro-wilk score. Continuous variables exhibiting normalcy of data for cases and controls were compared for significant mean with student t test while continuous variables having non-normal distribution were compared with Mann-Whitney test. Adjustment for age, tobacco consumption, & parity was not needed as cases were already matched with control in these aspects. The SIL data was categorized into quartiles according to distribution of various factors in control groups. Risk was estimated using binary logistic regression on case control pairs matched for age, menopausal and parity status. Odds Ratio was calculated for 4th quartile of CIN cases using interquartile range (IQR) as reference. In all tests of significance, two sided p values have been reported. Molar ratio between IGF-I and IGFBP-3 (MR-1) was calculated as 3.72 x IGF-I/IGFBP-3. Molar ratio between IGF-II and IGFBP-3 (MR-2) was calculated as 3.82 x IGF-II/IGFBP-3. Combined molar ratio (CMR) was calculated as 3.72 x {IGF-I + (1.02 x IGF-II)/IGFBP-3. Bio-effective molar ratio (BEMR) was calculated as 3.72 x {(0.25 x IGF-I) + (0.032 x IGF-II) + (0.0025 x C-peptide)} / {(1435 + IGFBP-3) – (2.79 x IGF-I) – (2.87 x IGF-II)}.
Results
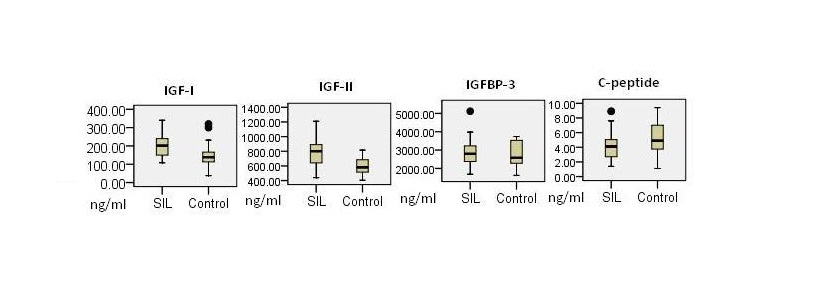
Mean plasma levels of IGF-I in SIL were significantly elevated than in control {202.8 (± 64.37) ng/ml in SIL versus 147.03 (± 62.65) ng/ml in controls; p= 0.001}. Likewise, mean levels of IGF-II in cases {781.22 (± 167.48) ng/ml} were significantly increased than controls {604.03 (± 104.31) ng/ml}, p<0.001. In contrast mean plasma levels of C-Peptide were significantly higher in controls then in cases (p = 0.04). IGFBP-3 levels were higher in SIL but statistically not significant (p= 0.89) while BMI was not significantly related in cases and controls (p=0.63). Molar ratio between IGF-I and IGFBP-3 (MR-1) was significantly increased in cases compared to controls (0.27 ng/ml; 95% CI = 0.23-0.31 & 0.19; 95% CI = 0.16-0.22 ng/ml, respectively); p =0.001. Likewise, molar ratio-2 (MR-2), combined molar ratio (CMR) and bio-effective molar ratio (BEMR) were significantly elevated in SIL (p<0.001 for each ratio) [Table/Fig-1,2 and 3]. Both IGF-I and IGF-II were positively correlated with IGFBP-3 (spearman correlation coefficient; p=0.319; 0.012 and 0.377;0.003, respectively). Likewise, IGF-I was associated positively with IGF-II (0.365;0.003).
Factors for SIL cases & control subjects.
| Variable | Controls | SIL | p value |
|---|
| N (number) | 31 | 31 | - |
| Mean age (SD) years | 33.25 (± 6.96) | 35.16 (±7.09) | 0.29 |
| Parity (SD) | 2.35 (0.83) | 2.45 (0.80) | 0.64 |
| N Tobacco users*(%) | 6 (19.35%) | 5 (16.12) | 0.74 |
| Mean IGF-I (SD) ng/ml | 147.03 (± 62.65) | 202.8 (± 64.37) | 0.001 |
| Mean IGF-II (SD) ng/ml | 604.03 (± 104.31) | 781.22 (± 167.48) | <0.001 |
| Mean IGFBP-3 (SD) ng/ml | 2818.5 (± 666.68) | 2867.41 (± 703.11) | 0.89 |
| Mean C-Peptide (SD) ng/ml | 5.31 (± 2.14) | 4.23 (± 1.96) | 0.04 |
| BMI (SD) kg/m2 | 20.24 (±3.45) | 20.65 (±3.28) | 0.63 |
| MR-1 (95% CI)† | 0.19 (0.16-0.22) | 0.27 (0.23-0.31) | 0.001 |
| MR-2 (95% CI)‡ | 0.85 (0.77-0.92) | 1.08 (0.98-1.17) | <0.001 |
| CMR (95% CI)§ | 1.04 (0.96-1.12) | 1.35 (1.23-1.47) | <0.001 |
| BEMR (95% CI) Π | 0.11 (0.08-0.12) | 0.29 (0.16-0.42) | <0.001 |
*Smoking/Chewing †MR-1 = 3.72 x IGF-I/IGFBP-3 ‡MR-2 = 3.82 x IGF-II/IGFBP-3 §CMR = 3.72 x (IGF-I + 1.02 x IGF-II)/IGFBP-3. Π BEMR = 3.72 x {(0.25 x IGF-I) + (0.032 x IGF-II) + (0.0025 x C-peptide)} / {(1435 + IGFBP-3) – (2.79 x IGF-I) – (2.87 x IGF-II)}.
Comparison between SIL cases and control for measured parameters.
Comparison between SIL cases and control for derived parameters

A dose dependent relationship (χ2 test for trend from 1st towards 4th quartile) was evident between risk of SIL and levels of IGF-I, IGF-II, MR-1, MR-2, CMR, BEMR (p=0.008, 0.003, 0.02, 0.001, 0.001, <0.001, respectively). When odds ratio (OR) was calculated for 4th quartile with inter-quartile range (IQR) as reference, OR was statistically significant for IGF-I (OR=3.94; p=0.02), IGF-II (OR= 4.57; p=0.01), MR-1 (OR=3.74; p=0.02), MR-2 (OR=5.15; p=0.004), CMR (OR=7.5; p=0.001) and BEMR (OR=12.18; p<0.001) OR was observed to be highest for BEMR while that for IGFBP-3 and C-Peptide was not statistically significant [Table/Fig-4].
Risk estimates of various factors.
| Quartiles | | |
|---|
| Variable | 1st | 2nd | 3rd | 4th | p-value from χ2 test for trend | Odds Ratio (95% CI) † |
|---|
| IGF-I | SIL | N (%)* | 1 (3.2) | 5 (16.1) | 6 (19.3) | 19 (61.2) | 0.008 | 3.94 (1.24-12.56) |
| Control | N (%) | 8 (25.8) | 8 (25.8) | 8 (25.8) | 7 (22.5) |
| IGF-II | SIL | N (%) | 1 (3.2) | 3 (9.6) | 7 (22.5) | 20 (64.5) | 0.003 | 4.57 (1.42-14.7) |
| Control | N (%) | 8 (25.8) | 8 (25.8) | 8 (25.8) | 7 (22.5) |
| IGFBP-3 | SIL | N (%) | 6 (19.3) | 6 (19.3) | 14 (45.1) | 5 (16.1) | 0.30 | 0.56 (01.61-1.96) |
| Control | N (%) | 8 (25.8) | 8 (25.8) | 7 (22.5) | 8 (25.8) |
| C-peptide | SIL | N (%) | 13 (41.9) | 10 (32.2) | 4 (12.9) | 4 (12.9) | 0.31 | 1.74 (0.55-5.46)‡ |
| Control | N (%) | 8 (25.8) | 8 (25.8) | 7 (22.5) | 8 (25.8) |
| MR-1 | SIL | N (%) | 2 (6.4) | 5 (16.1) | 6 (19.3) | 18 (58.1) | 0.02 | 3.74 (1.17-11.96) |
| Control | N (%) | 8 (25.8) | 8 (25.8) | 8 (25.8) | 7 (22.5) |
| MR-2 | SIL | N (%) | 1 (3.2) | 2 (6.4) | 6 (19.3) | 22 (70.9) | 0.001 | 5.15 (1.58-16.77) |
| Control | N (%) | 8 (25.8) | 8 (25.8) | 7 (22.5) | 8 (25.8) |
| CMR | SIL | N (%) | 1 (3.2) | 3 (9.6) | 3 (9.6) | 24 (77.4) | 0.001 | 7.5 (2.17-25.9) |
| Control | N (%) | 8 (25.8) | 8 (25.8) | 7 (22.5) | 8 (25.8) |
| BEMR | SIL | N (%) | 1 (3.2) | 2 (6.4) | 2 (6.4) | 26 (83.8) | <0.001 | 12.18 (3.13-47.39) |
| Control | N (%) | 8 (25.8) | 8 (25.8) | 7 (22.5) | 8 (25.8) |
*N (%); Number (Percentage), †OR for 4th quartile with IQR as ref. ‡OR for 1st quartile with IQR as ref.
When mean values of LSIL and HSIL cases were compared, it was observed that none of the variables (IGF-I, IGF-II, & C-peptide) and derived variables (MR-1, MR-2, CMR, & BEMR) were different statistically except for IGFBP-3 (p= 0.03). When LSIL or HSIL were compared with controls the results matched as for SIL vs. controls [Table/Fig-5].
Factors for LSIL, HSIL cases & control† subjects.
| Variable | LSIL | HSIL | p valueLSIL Vs HSIL | p valueLSIL Vs Control† | p valueHSIL Vs Control† |
|---|
| N | 15 | 16 | - | - | - |
| Mean age (SD) years | 34.66 (±7.57) | 35.62 (±6.83) | 0.62 | 0.61 | 0.21 |
| Tobacco N (%)* | 3 (20%) | 3 (18.75%) | 0.93 | 0.75 | 0.82 |
| Parity (SD) | 2.40 (±0.73) | 2.50 (±0.89) | 0.73 | 0.86 | 0.58 |
| IGF-I mean (SD) ng/ml | 201.2 (±65.38) | 204.31 (±65.52) | 0.86 | 0.01 | 0.006 |
| IGF-II mean (SD) ng/ml | 759.86 (±201.51) | 801.25 (±131.59) | 0.49 | 0.01 | <0.001 |
| IGFBP-3 mean (SD) ng/ml | 2597.33 (±582.16) | 3120.62 (±728.74) | 0.03 | 0.31 | 0.24 |
| C-Peptide mean (SD) ng/ml | 4.05 (±1.98) | 4.4 (±2.01) | 0.54 | 0.07 | 0.21 |
| BMI (SD) kg/m2 | 21.0 (±4.08) | 20.32 (±2.42) | 0.57 | 0.51 | 0.93 |
| MR-1 (95% CI) | 0.3 (0.23-0.36) | 0.24 (0.2-0.29) | 0.20 | 0.002 | 0.02 |
| MR-2 (95% CI) | 1.14 (0.97-1.31) | 1.01 (0.89-1.14) | 0.23 | 0.002 | 0.005 |
| CMR (95% CI) | 1.44 (1.24-1.65) | 1.26 (1.13-1.39) | 0.28 | <0.001 | 0.002 |
| BEMR (95% CI) | 0.39 (0.12-0.66) | 0.19 (0.15-0.24) | 0.71 | <0.001 | <0.001 |
*N (%); Number (percentage) †Controls are same as in [Table/Fig-1].
Discussion
To the best of our knowledge, it is the first case control study to investigate the relationship between plasma levels of IGF-I, IGF-II, IGFBP-3, & C-Peptide and risk of SIL in Indian cohorts. Plasma levels of IGF-I levels were significantly elevated in histologically proven SIL cases as compared to controls (p=0.001). We also observed an upward trend in observed cases in first quartile through fourth quartile & this trend was statistically significant (p=0.008). The percentage of SIL cases in 4th quartile of IGF-I was 61.2% while that in IQR was 35.4%. OR for 4th quartile compared with IQR as reference was statistically significant (p=0.02). Earlier studies have demonstrated a strong association of IGF-I with colorectal cancer [16], prostate cancer [17], breast cancer [18], lung cancer [19]. There are only three studies [2,3,20] that measured circulating levels of IGF-I in SIL. In the first study, Wu X et al., in a much larger study of 267 cases, also found a highly significant association of IGF-I levels between precancerous stage and control [2]. Second study by Serrano ML et al., with a smaller sample size of DNA +ve pap smear, reported a slightly higher serum levels of IGF-I in LSIL versus controls, though the difference was statistically insignificant [3]. Interestingly the same study, showed a trend from 1st through 4th quartile which was only marginally insignificant (p=0.057) though they found neither the significantly elevated levels nor observed any significant trend in HSIL vs. control. While the study by Serrano et al., was essentially a link between HPV infection and serum IGF-I levels [3], Nakamura et al., reported that expression of both IGF-I and IGF-IR was not dependent upon HPV [21]. In the third small prospective study [20] high IGF-I was non-significantly associated with oncogenic HPV+ve SIL. A recent study has also associated IGF-I promoter P1 polymorphism with risk of cervical cancer [4]. IGF-I can interact with IGF-IR [7] consequently IGF-1R over expression is also implicated in several cancers as prostate cancer [22]. Numerous invitro studies have suggested that IGF-I is able to exert its mitogenic actions by several pathways that may include IGF-I/IRS-I axis, Wnt pathway, increased angiogenesis, and by increased production of cyclin D1[23,24]. It is plausible that both HPV and IGF signaling system may have a role to play in risk of development of SIL.
IGF-II level were significantly elevated in SIL patients as compared to controls (p<0.001). Highest percentage of cases occurred in 4th quartile (64.5%) as compared to IQR (32.1%). Besides there was significant upward trend from 1st quartile through 4th quartile (p=0.003) and a statistically significant OR for 4th quartile when IQR was taken as reference (p=0.01). Two studies have linked IGF-II levels with SIL. In first study, Mathur et al., observed that levels of IGF-II were significantly higher in precancerous cases than controls [25]. While second study did not find any significant association of IGF-II levels between HPV +ve LSIL or HSIL and controls [3]. Cervical cancer proliferation is dependent upon up regulation of IGF-II [5]. Cervical cancer cells have high levels of IGF-II and treatment with IGFBP-3 caused a significant reduction in cellular IGF-II levels [26]. Similarly, in cancer other than cervical cancer or SIL, a case-control study [27] reported significantly elevated serum levels of IGF-II in highest quartile in advanced colorectal adenoma. IGF-II induces STS expression via a PI3-kinase/Akt-NF-κB signaling pathway in PC-3 cells and may induce estrogen production and estrogen-mediated carcinogenesis [28]. IGF-II gene is over expressed in colon cancer [29] & loss of imprinting of IGF-II gene represents a risk factor for colorectal cancer [30]. Both IGF-I & II can interact with IGF-1R [7], consequently IGF-1R over expression is also implicated in several cancers for e.g., prostate cancer [22]. Evidently, invitro studies link IGF-II with cervical cancer and results of our study are consistent with Mathur et al [25].
In the present study IGFBP-3 levels were slightly increased in SIL cases than control but this increase was not statistically significant (p=0.89). In study by Mathur et al., IGFBP-3 levels were reported to be signifi cantly reduced in women with precancerous stage [25], whereas Wu et alfound higher serum levels of IGFBP-3 in SIL cases than in controls [2]. High levels of EGF receptors were reported in cervical cancer & EGF stimulates growth of HPV 16 immortalized cervical epithelial cells via reduction in IGFBP-3 levels [31]. Harris TG concluded that high IGFBP-3 levels could lead to less replication/or greater loss of oncogenic HPV infected squamous cells [20]. Elevated IGFBP-3 has been found to reduce cancer risk in several studies [16,18,32]. Chan JM also found that elevated IGFBP-3 tended to be associated with increase rather than decrease in cancer risk [17]. Though IGFBP-3 sequestration of IGF-I from IGF-IR is usually inhibitory, IGFBP-3 can enhance IGF-I effects by presenting and slowly releasing IGF-I for IGF-I receptor interaction while protecting the IGF-I receptor from down regulation by high IGF-I exposure [33] IGFBP-3 has contradictory effects in either potentiating or inhibiting IGFs action [7]. Such ambiguity in IGFBP-3 results, as in our study, has also been reported in breast cancer [34].
Till date no study has correlated C-Peptide levels in SIL cases and controls. In our study C-peptide level was significantly decreased in SIL cases than controls (p=0.04) while both odds and trend was observed to be insignificant (p=0.34 and p=0.31). Nevertheless, we observed that 41.9% SIL cases occurred in 1st quartile for C-Peptide than 45.1% in IQR. C-Peptide is a marker of endogenous insulin secretion and insulin levels were found to be increased in endometrial cancer than in controls [35]. Insulin stimulates cell proliferation and inhibit apoptosis directly through insulin receptors and can also increase IGF-I bioactivity by down regulating IGF binding proteins synthesis [36]. Obesity cause insulin resistance and is a well established risk factor for hormone related cancers, such as breast, endometrial & colorectal cancers [16,32,37]. Contrary to this, we found decreased levels of C-peptide in pre-cancerous stage. It could be attributed to the fact that we found no obese patients in SIL; in fact 96.7% SIL cases had BMI of < 27 kg/m2. Daniel A et al., showed severity of insulin resistance increases in line with the BMI in a hyperbolic manner whereas insulin levels are independent up to a BMI of 27 kgm-2 [38]. Nevertheless role of insulin on IGF/GH axis cannot be underplayed as insulin influences the synthesis of IGF-I & IGFBP-3.
In studies [2,3], elsewhere, molar ratio of IGF-I or IGF-II to IGFBP-3 has been defined which reveals the extent of free IGF-I or IGF-II. In our study, we have formulated two more ratios, namely CMR (Combined Molar Ratio) and BEMR (Bio-Effective Molar Ratio). CMR was formulated as a cumulative measure of free IGF-I and IGF-II while BEMR was formulated based on the fact that IGF-I, IGF-II and insulin could affect the downstream signaling cascade through IGF-IR [39]. This was also taken in account that IGF-II could bind to IGF-IR with affinity 2-15 times (an average of ~ 8 times) less than IGF-I while insulin 1000 times less than IGF-I [40]. About 75% of both IGF-I and IGF-II are bound to IGFBP-3 in a heterotrimeric complex [10] while the remaining 25% of IGF-I and IGF-II is available to bind to other IGF binding protein or as free IGF-I and IGF-II [11]. Thus these potentially mitotic factors (IGF-I, IGF-II, C-peptide) were kept in numerator as (25% moles IGF-I) + (25% moles of IGF-II x 1/8) + (moles of C-peptide x 1/1000). The denominator consisted of IGFBP-3 that is left after binding 75% of IGF-I and IGF-II. This excess IGFBP-3 is a measure of fraction that has potential to bind to 25% non-IGFBP-3 bound IGF-I and IGF-II and may decide the bioavailable free form of IGFs. To the denominator was added a corrective factor to expunge the possibility of a negative overall value and was designed as moles of IGFBP-3 – 75% of moles of IGF-I – 75% of moles of IGF-II + 0.05. The final BEMR ratio, on solving numerator and denominator, is BEMR = 3.72 x {(0.25 x IGF-I) + (0.032 x IGF-II) + (0.0025 x C-peptide)} / {(1435 + IGFBP-3) – (2.79 x IGF-I) – (2.87 x IGF-II)}. Rationale for adding C-peptide in BEMR was that, besides IGFBP-3, levels of IGF-1 could also be dependent on nutritional status and insulin. All factors considered in BEMR are in units of ng/ml.
MR-1, MR-2, CMR, BEMR were significantly elevated in SIL compared to controls (p=0.001, p<0.001, p<0.001, p<0.001, respectively) and the percentage of SIL cases in 4th quartile were 58.0%, 70.9%, 77.4%, 83.8%, respectively. Besides OR for 4th quartile was highest for BEMR (and highly significant, p<0.001) than MR-1, MR-2 and CMR when IQR was taken as reference [Table/Fig-1,2]. Major finding of our study is the effect of BEMR, which emerges out to be the strongest predictor of SIL compared to other derived ratios and thus there is a possibility, for it, to be explored as a potential quadruple test for screening SIL. It is beyond the scope of present paper to assess whether increased IGF-I, IGF-II, IGFBP-3, C-Peptide levels & BEMR are in the causal pathway or for monitoring these variables during course of therapy. More exhaustive prospective studies are required to be undertaken for approaching these issues. A comparison of LSIL and HSIL mean levels of various variables (IGF-I, IGF-II, C-Peptide, MR-1, MR-2, CMR, BEMR) revealed non significant alterations in mean levels except for IGFBP-3 which was significantly elevated in HSIL when compared to LSIL (p=0.03). It is plausible that that significantly elevated IGFBP-3 in HSIL occurred by body’s response towards exposure to high levels of IGF-I and IGF-II during progression from LSIL to HSIL.
Conclusion
In conclusion, our data supports a potential role for elevated IGF-I, IGF-II and BEMR in pathogenesis of SIL. Circulating levels of IGFBP-3 and C-Peptide, though having a dynamic interaction with IGF-I and IGF-II, do not appear to have direct involvement in etiology of SIL.
Conflict of Interest Statement
None of the authors have nothing to disclose.
*Smoking/Chewing †MR-1 = 3.72 x IGF-I/IGFBP-3 ‡MR-2 = 3.82 x IGF-II/IGFBP-3 §CMR = 3.72 x (IGF-I + 1.02 x IGF-II)/IGFBP-3. Π BEMR = 3.72 x {(0.25 x IGF-I) + (0.032 x IGF-II) + (0.0025 x C-peptide)} / {(1435 + IGFBP-3) – (2.79 x IGF-I) – (2.87 x IGF-II)}.
*N (%); Number (Percentage), †OR for 4th quartile with IQR as ref. ‡OR for 1st quartile with IQR as ref.
*N (%); Number (percentage) †Controls are same as in [Table/Fig-1].