Fixed prosthodontic treatment involves complete or partial coverage of natural tooth or dental implant abutments. It depends on fabrication of a definitive prosthesis in the dental laboratory [1]. Fabrication of the final prosthesis takes about 8-10 days. During this time period, the prepared tooth needs to be protected from the oral environment and its relationship with the adjacent and opposing tooth needs to be preserved. Hence, in order to protect these prepared abutment teeth, temporary restorations are fabricated. These interim restorations are also beneficial for diagnostic purposes where the functional, stabilizing, occlusal and esthetic parameters are developed to identify an optimum treatment result before the completion of definitive prosthesis [1].
While selecting a material for a temporary restoration, physical and mechanical properties of the materials should be considered. Clinically significant properties include strength of the material, its rigidity and reparability, exothermic reaction following polymerization and subsequent polymerization shrinkage, marginal integrity and colour stability [2]. Presently there is no single material that meets the optimal requirements for all the situations [3]. However, there are materials that have been successfully used for this purpose. These are Poly Methyl Methacrylate Resins (PMMA), Poly Ethyl Methacrylate Resins (PEMA), vinyl ethyl methacrylate resins, butyl methacrylate, epimine, preformed matrices of plastic and cellulose shells, metals, polycarbonate materials, bis-acryl composites, bis-GMA composites, Urethane Di Methacrylate Resins (UDMA) [4].
The most common materials for custom interim fixed partial denture are acrylic resins. PMMA were introduced in 1936 as a heat processed thermosetting material. In early 1940’s, it was available as a room temperature polymerizing methacrylate. It was quickly improved for the field of dentistry as a self-curing prosthetic and restorative resin [5]. Acrylic based resins consist of polymeric materials based on PMMA. These materials are a result of a free radical polymerization reaction initiated chemically. PMMA resins are relatively inexpensive with ease of handling, excellent polish and good marginal adaptation. The major drawback of these materials is the exothermic polymerization; high polymerization shrinkage and low wear resistance [6].
Bis-acryl composite were introduced with an aim to overcome the negatives of the methacrylate [3]. They are available as preloaded syringes or cartridges and mixed through an auto mixing tip. This provides consistent mixture with no air incorporation into the final mix [7]. Bis-acryl composites consist of bi-functional substrates to provide cross linkage with one another and form monomer chain cross linkage leading to increase in impact strength and toughness [8]. They also contain inorganic fillers to increase their abrasion resistance. Bis-acryl composite resins have low polymerization shrinkage [3], low exothermic reaction, reduced tissue toxicity, good wear resistance and strength. But these materials are expensive, brittle and have less polish ability and their repair is difficult [6]. Wang RL et al., in 1989 and Osman YI et al., in 1993 found that methyl methacrylate provisional materials had higher flexural strength than the composite material [9,10]. On the contrary Young HM et al., compared bis-acryl and PMMA materials in terms of occlusion, contour, marginal adaptability and finish [11]. For both anterior and posterior teeth, they found the bis acryl material significantly superior to PMMA in all categories. Due to this confusion and the urge to determine and predict the possible reasons for such discrepancy, an attempt was made to evaluate and compare the flexural strength of these two main groups of temporary crown and bridge materials.
Materials and Methods
This in-vitro study was conducted in the Department of Prostho-dontics including Crown and Bridge, M. M. College of Dental Sciences and Research, Mullana, (Ambala), Haryana, India and Central Institute of Plastics Engineering and Technology, Murthal (Sonipat), Haryana, India. The study period was almost a month. Six commercially available temporary fixed partial denture materials considered were:
Poly methyl methacrylate based temporary materials available in powder liquid form:
DPI self-cure tooth molding powder (DPI, The Bombay Burmah Trading Corp. Ltd., Batch 3152, Mumbai, India).
SC10 tooth colored cold cure (Jagdish Lal Sethi Company, Batch SC411, Wazirpur, Delhi, India).
Trulon acrylic crown and bridge Trulon (Jayna Industries, Ghaziabad, UP, India).
Bis-acryl composite based temporary materials available as cartridge with dispensing gun and mixing tips:
Protemp 4 temporization material (3M ESPE, Lot 559121, Germany).
Cooltemp natural (Coltene Whaledent, Lot F27307, Article no- 5805, Switzerland).
Luxatemp fluorescence (DMG, Lot 705679, Hamburg, Germany).
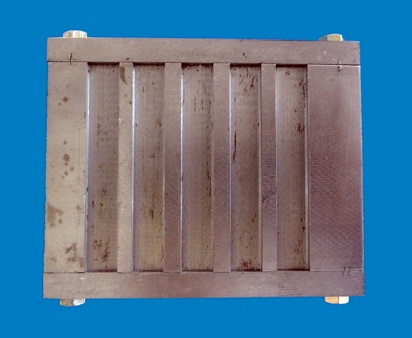
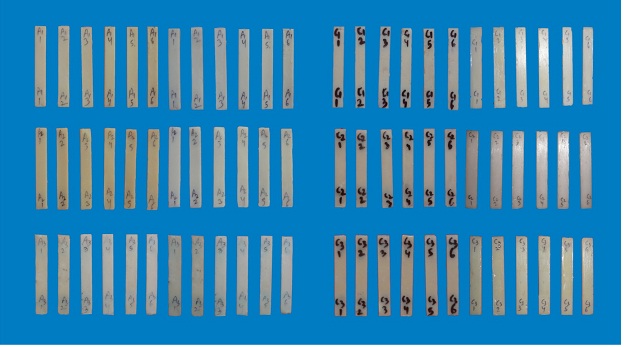
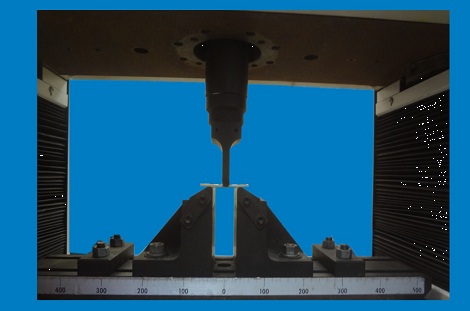
A custom made metal mould was used for making specimens. It was a rectangular mold with five slots of dimensions 64mm×10mm×2.5mm [Table/Fig-1]. It was open on one side with adjustable screws on the ends to carefully remove the samples. Twelve specimens for each material were prepared in the form of rectangular bars. Petroleum jelly was applied on inner surface of the mould with the help of a brush. PMMA resins were manipulated according to manufacturer’s instructions in a dappen dish using a mixing spatula. The mix was expressed into the mould slots to its capacity and a glass slab was pressed tightly against the mould to remove excess material. For the bis-acryl composites, the material was dispensed into the slots directly using a dispensing gun. The material was allowed to set. Once material was set, the adjustment screws were loosened. Specimens were removed from the mould, excess was trimmed and finishing was done. A total of 72 samples were prepared and marked with a specific number describing the type of material and the order of their fabrication [Table/Fig-2]. The marking was done on both ends to facilitate the relocation of broken samples during repair procedures. All specimens were divided into two groups consisting of 36 specimens each (six specimens from each material) and were stored in artificial saliva in labelled plastic jars. Specimens were tested at a time interval of 24 hours and 8 days respectively using Instron Universal Testing Machine having a maximum capacity of 100 KN and a digital recording system [Table/Fig-3]. Three point bending test was performed at a crosshead speed of 5mm/minute until failure and flexural strength was recorded for all specimens. The force was calculated in Newton (N) and converted to stress (N/mm2).
Total specimens for polymethyl methacrylate materials and bis-acrylic provisional restorative materials.
Placement of sample in UTM machine.
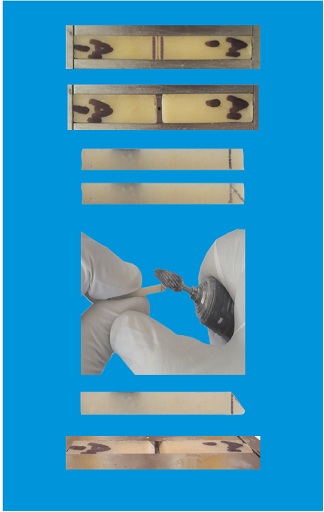
The broken specimens from the 8 day study were collected, washed and cleaned. The numbering done previously on the corresponding ends allowed realignment in the original position [Table/Fig-4]. An equal gap between the fractured ends of all samples was planned to maintain the standardizations and to provide space for the material to flow. A distance of 1mm from each side of the fractured line was marked. The sample was cut at these lines with a separating disk and the ends were finished. For all the samples, the space between the edges to be repaired when placed in the mould was 2mm. Also a 450 degree bevel was prepared to increase the inter-facial bond area. To achieve that, a distance equal to the thickness of the sample (2.5mm) from the prepared edge was measured and a line parallel to the edge was drawn at this point. The upper end of this line and the lower end of the edge to be repaired were joined. The trimming along the line angles formed was done freehand. The two parts of the sample were placed back in the mould as fit to keep the dimensions of repair surfaces constant. A layer of petroleum jelly was applied on the mold with a brush. The empty space in between the finished samples was filled with the respective material. The material was allowed to set. Once set, the repaired indices were removed from the mould, finished and kept in artificial saliva for 24 hours. Testing of the repaired samples was done using the same Instron Universal Testing Machine (UTM) machine and the values of fracture were recorded. Values obtained were compared statistically by using one way Anova and Post hoc test.
Steps in repair of provisional restorative materials.
Place the fractured pieces of the sample in the mould as fit. Mark a line on each side at a distance of 1mm from the fracture point. Trim the sample at these lines. The edges to be repaired are at 2mm distance from each other. Mark a point along the length of the sample equal to the thickness (2.5mm). Draw a line parallel to the end at this pointJoin the upper end of this line and the lower end of the finished edge to be repaired Trim the angle freeh and to get a 45° bevel.
Results
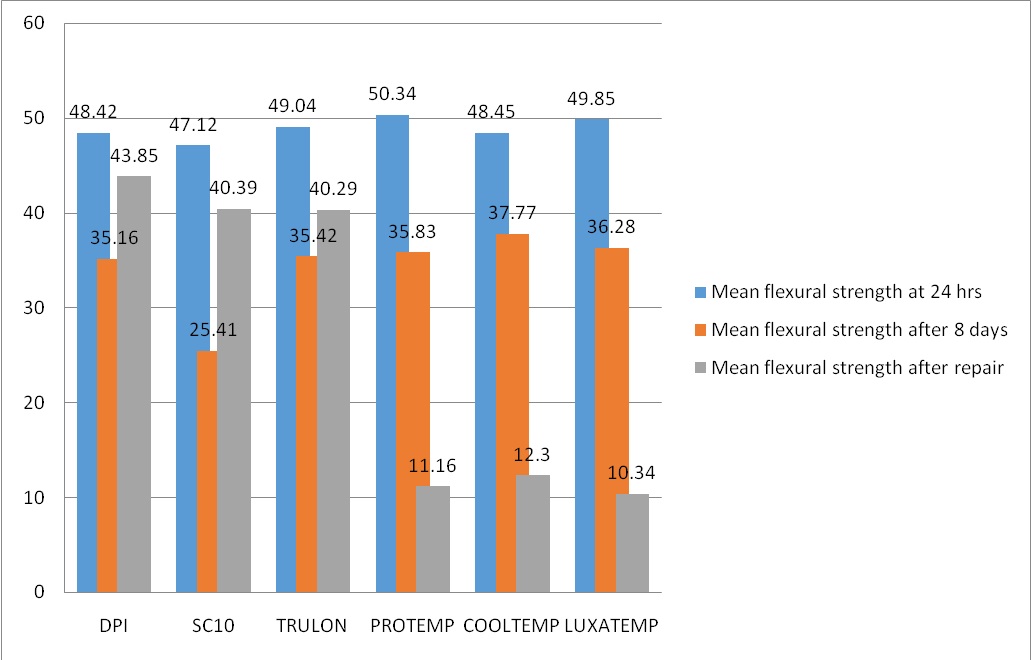
The force required to fracture the specimens is shown in [Table/Fig-5]. It shows a non-significant difference (p>0.05) in flexural strength between all the test materials when compared to each other at 24 hour time interval [Table/Fig-6,7]. However, a significant decrease (p<0.05) in strength was observed for all the specimens when tested at 8 days interval. Though no statistical difference was seen between the rest of the five materials, lowest values were observed with SC10 [Table/Fig-8]. Specimens tested after repair shows a significant decrease (p<0.001) in flexural strength for Protemp, Cooltemp and Luxatemp materials though no difference in flexural strength was observed within the group tested [Table/Fig-9,10].
Maximum stress values recorded for various test materials.
| Max Stress At 24 Hours |
|---|
| N | Mean (N/mm2) | Std. Deviation |
|---|
| DP1 | 6 | 48.4209 | 2.85850 |
| SC 10 | 6 | 47.1252 | 4.42714 |
| TRULON | 6 | 49.0428 | 2.15311 |
| PROTEMP | 6 | 50.3430 | 1.01415 |
| COOLTEMP | 6 | 48.4543 | 2.58673 |
| LUXATEMP | 6 | 49.8522 | 1.61715 |
| TOTAL | 36 | 48.8731 | 2.68969 |
| Max Stress At 8 Days |
| N | Mean (N/mm2) | Std. Deviation |
| DP1 | 6 | 35.5653 | 2.71534 |
| SC 10 | 6 | 25.4111 | 2.51933 |
| TRULON | 6 | 35.4253 | 3.08689 |
| PROTEMP | 6 | 35.8305 | 2.14558 |
| COOLTEMP | 6 | 37.7725 | 7.19616 |
| LUXATEMP | 6 | 36.2810 | 4.58418 |
| TOTAL | 36 | 34.3809 | 5.61696 |
| Max Stress After Repair |
| N | Mean (N/mm2) | Std. Deviation |
| DP1 | 6 | 43.8559 | 3.66527 |
| SC 10 | 6 | 40.3922 | 1.91561 |
| TRULON | 6 | 40.2941 | 1.99560 |
| PROTEMP | 6 | 11.1699 | 1.41091 |
| COOLTEMP | 6 | 12.3046 | 2.01080 |
| LUXATEMP | 6 | 10.3410 | 1.93869 |
| TOTAL | 36 | 26.3929 | 15.53501 |
Comparison of flexural strength for all provisional materials tested by one way ANOVA at 24 hours, 8 days and after repair.
| ANOVA at 24 hours |
|---|
| Max stress | Sum of Squares | df | Mean Square | F | Sig. | Remarks |
|---|
| Between Groups | 39.499 | 5 | 7.9 | 1.109 | 0.376 | NS |
| Within Groups | 213.706 | 30 | 7.124 | | | |
| Total | 253.205 | 35 | | | | |
| ANOVA after 8 days |
| Max stress | Sum of Squares | df | Mean Square | F | Sig. | Remarks |
| Between Groups | 600.997 | 5 | 120.199 | 7.165 | <0.001 | HS |
| Within Groups | 503.26 | 30 | 16.775 | | | |
| Total | 1104.26 | 35 | | | | |
| ANOVA after Repair |
| Max stress | Sum of Squares | df | Mean Square | F | Sig. | Remarks |
| Between Groups | 8292.388 | 5 | 1658.478 | 322.256 | <0.001 | HS |
| Within Groups | 154.394 | 30 | 5.146 | | | |
| Total | 8446.782 | 35 | | | | |
Comparison of flexural strength for all provisional materials tested by Post Hoc analysis at 24 hours.
| Post Hoc Test |
|---|
| DependentVariable | (I) Material | (J) Material | Mean Difference (I-J) | Std. Error | Sig. | 95% Confidence Interval | Remarks |
|---|
| Lower Bound | Upper Bound |
|---|
| Max stress | Bon-ferroni | DPI | SC 10 | 1.29568 | 1.541 | 1.000 | -3.618 | 6.21 | NS |
| Trulon | -0.6219 | 1.541 | 1.000 | -5.536 | 4.292 | NS |
| Protemp | -1.9221 | 1.541 | 1.000 | -6.836 | 2.992 | NS |
| Cooltemp | -0.0334 | 1.541 | 1.000 | -4.947 | 4.88 | NS |
| Luxatemp | -1.4313 | 1.541 | 1.000 | -6.345 | 3.482 | NS |
| SC 10 | Trulon | -1.9176 | 1.541 | 1.000 | -6.831 | 2.996 | NS |
| Protemp | -3.2178 | 1.541 | 0.68 | -8.132 | 1.696 | NS |
| Cooltemp | -1.3291 | 1.541 | 1.000 | -6.243 | 3.585 | NS |
| Luxatemp | -2.727 | 1.541 | 1.000 | -7.641 | 2.187 | NS |
| Trulon | Protemp | -1.3002 | 1.541 | 1.000 | -6.214 | 3.614 | NS |
| Cooltemp | 0.58846 | 1.541 | 1.000 | -4.325 | 5.502 | NS |
| Luxatemp | -0.8095 | 1.541 | 1.000 | -5.723 | 4.104 | NS |
| Protemp | Cooltemp | 1.8887 | 1.541 | 1.000 | -3.025 | 6.803 | NS |
| Luxatemp | 0.49079 | 1.541 | 1.000 | -4.423 | 5.405 | NS |
| Cool-temp | Luxatemp | -1.3979 | 1.541 | 1.000 | -6.312 | 3.516 | NS |
Comparison of flexural strength for all provisional materials tested by Post Hoc analysis at *Significant, 8 days.
| POST HOC TEST |
|---|
| Dependent Variable | (I) Material | (J) Material | Mean Difference (I-J) | Std. Error | Sig. | 95% Confidence Interval | Remarks |
|---|
| Lower Bound | Upper Bound |
|---|
| Max stress | Bon-ferroni | DPI | SC 10 | 10.15422* | 2.3647 | <0.001 | 2.6137 | 17.695 | HS |
| Trulon | 0.13993 | 2.3647 | 1.000 | -7.4006 | 7.6805 | NS |
| Protemp | -0.2652 | 2.3647 | 1.000 | -7.8058 | 7.2753 | NS |
| Cooltemp | -2.2072 | 2.3647 | 1.000 | -9.7478 | 5.3333 | NS |
| Luxatemp | -0.7157 | 2.3647 | 1.000 | -8.2563 | 6.8248 | NS |
| SC 10 | Trulon | -10.01428* | 2.3647 | <0.001 | -17.555 | -2.4737 | HS |
| Protemp | -10.41943* | 2.3647 | <0.001 | -17.96 | -2.8789 | HS |
| Cooltemp | -12.36143* | 2.3647 | <0.001 | -19.902 | -4.8209 | HS |
| Luxatemp | -10.86992* | 2.3647 | <0.001 | -18.411 | -3.3294 | HS |
| Trulon | Protemp | -0.4052 | 2.3647 | 1.000 | -7.9457 | 7.1354 | NS |
| Cooltemp | -2.3472 | 2.3647 | 1.000 | -9.8877 | 5.1934 | NS |
| Luxatemp | -0.8556 | 2.3647 | 1.000 | -8.3962 | 6.6849 | NS |
| Protemp | Cooltemp | -1.942 | 2.3647 | 1.000 | -9.4826 | 5.5985 | NS |
| Luxatemp | -0.4505 | 2.3647 | 1.000 | -7.991 | 7.0901 | NS |
| Cool-temp | Luxatemp | 1.49151 | 2.3647 | 1.000 | -6.049 | 9.0321 | NS |
Comparison of flexural strength for all provisional materials tested by Post Hoc analysis at *Significant after repair.
| POST HOC TEST |
|---|
| Dependent Variable | (I) Material | (J) Material | Mean Difference (I-J) | Std. Error | Sig. | Remarks |
|---|
| Max stress | Bon-ferroni | DPI | SC 10 | 3.46371 | 1.30976 | 0.19 | NS |
| Trulon | 3.56174 | 1.30976 | 0.16 | NS |
| Protemp | 32.68600* | 1.30976 | <0.001 | HS |
| Cooltemp | 31.55129* | 1.30976 | <0.001 | HS |
| Luxatemp | 33.51490* | 1.30976 | <0.001 | HS |
| SC 10 | Trulon | 0.09803 | 1.30976 | 1.000 | NS |
| Protemp | 29.22229* | 1.30976 | <0.001 | HS |
| Cooltemp | 28.08758* | 1.30976 | <0.001 | HS |
| Luxatemp | 30.05119* | 1.30976 | <0.001 | HS |
| Trulon | Protemp | 29.12426* | 1.30976 | <0.001 | HS |
| Cooltemp | 27.98955* | 1.30976 | <0.001 | HS |
| Luxatemp | 29.95316* | 1.30976 | <0.001 | HS |
| Protemp | Cooltemp | -1.13471 | 1.30976 | 1.000 | NS |
| Luxatemp | 0.8289 | 1.30976 | 1.000 | NS |
| Cool-temp | Luxatemp | 1.96361 | 1.30976 | 1.000 | NS |
Mean flexural strength of all materials at 24 hours, after 8 days and after repair.
Discussion
Provisional restorations are essential elements of fixed prosthodontic treatment. Provisional restoration must accomplish several functions for the duration of the use in the mouth. They should shield pulpal tissue against physical, biochemical and thermal injuries, maintain positional stability and occlusal function, should provide strength, retention and aesthetics for the prepared teeth [12]. In addition, they may be used for correcting irregular occlusal plane, altering vertical dimensions and changing the contour of the gingival tissue [13].
The materials and techniques used for these purposes must reflect variable treatment demands and requirements. Many of the requirements of these materials such as appropriate marginal adaptation, low thermal conductivity, low polymerization shrinkage, good colour stability, ease of cleaning, ease of contour and alterability and repair are extremely important to the success of treatment outcome. Consistent with nearly all areas of dental management where material science plays a significant role, there is presently no material suitable for all clinical condition [12,13].
The flexural strength (transverse strength, bending strength or modulus of rupture) is defined as force per unit area at the instant of fracture in a test specimen subjected to flexural loading [14]. The flexure strength is obtained when one load a single beam simply supported at each end with a load in middle, such a test is called a three point bending or flexure test and the maximum stress measured in the test is called flexure strength. This test determines not only the strength of the material indicated but also the amount of distortion expected. The equation for the maximum stress developed in a rectangular beam loaded in the centre of the span is as follows [15]:
σ = 3PL/2wt2
σ- Maximum flexural stress (N/mm2)
P- Load at fracture (N)
L- Distance between two supports (mm)
w- Width of specimen
t- Thickness of specimen
In this study, 12 rectangular specimens were fabricated for each material and stored in artificial saliva in separate plastic jars. They were tested for flexural strength after 24 hours, 8 days and after repair. The results were obtained and statistically compared by one way ANOVA and Post-Hoc tests.
At 24 hours’ time interval, a non-significant difference in flexural strength was seen between all the materials. The fracture toughness at this time interval was similar for both the groups. However, the highest value of flexural strength was exhibited by Protemp, a bis-acryl composite resin. and Osman YI et al., in 1993 and Koumjian JH et al., in 1990 concluded that there was no significant difference between methyl methacrylate and bis-acryl interim resins [10,16]. Haselton DR et al., compared the transverse strength of five auto-polymerizing PMMA resins and eight bis-acryl composite resins and demonstrated that most bis-acryl composites had a higher strength [8]. Ireland MF and Dixon DL tested the modulus of rupture of four provisional materials and found bis acryl composites had the highest flexural strength [17]. This can be credited to the fact stated by Atsuta that bis-acryl composites contain multifunctional monomers, which increase strength due to cross linking [18]. According to Rawls HR, the 3-D network of cross linked polymers chains forms a rigid structure for the composite resins as the entire network acts as one unit. This phenomenon gives strength and rigidity to bis-acryl composite resins [19].
At 8 days’ time gap, a significant decrease in flexural strength was observed as compared to the 24 hours group for all the samples. However, there was a non-significant difference in flexural strength between PMMA and bis-acryl composite groups after 8 days. The minimum value for flexural strength was observed for SC10. According to Kawahara in 2004, Faltermeier in 2007 and Leon in 2008, the water absorption of PMMA and bis-acryl composite materials might be a possible explanation for the decrease in strength after conditioning in water. Excessive water uptake can promote breakdown causing a filler matrix debonding. Absorbed molecules (e.g., water, saliva) spread polymer chains apart and facilitate slippage between chains. This lubricating effect is called plasticization [20]. Koumjian JH et al., who tested the PMMA materials, immediately after fabrication, 7 days of dry storage, 7 days of wet storage and after repair concluded that the maximum strength for the specimens can be achieved after 24 hours of fabrication. The stress values can drop considerably after storage in artificial saliva for 7 days’ time gap due to the plasticizing effects of the water [16].
According to Lang R et al., PMMA materials showed water absorption up to 32μm/mm, primarily because of the polar properties of the resin molecules, which may act as a plasticizer and thus reduce the fracture strength of the material [21]. Rawls HR et al., have stated, when water penetrates into the space between the polymer chains and pushes them further apart, the van der Waals forces between the polymer chains decline [19]. This adds weight and causes volume to increase. The greater the absorption of water by the material, lower the strength. Another reason could be the degree of polymerization which is low for these materials leading to higher residual monomer content (3%-5%), which acts as an internal plasticizer [22]. Anusavice KJ stated the residual monomer is soluble and leaches out during storage, further decreasing the strength and hardness [5].
After repair, there was a highly significant difference between the flexural strength of PMMA and bis-acryl composite groups. The maximum flexural strength was demonstrated by PMMA based materials while the lowest strength was observed for bis- acrylic composite materials after repair. The results for bis-acrylic group are in accordance with Bohnenkamp DM et al., who stated that the fractured samples and the novel repair material cannot react chemically with the joint at the interface for these resin materials [23]. This leads to a substantially low range of stress value. According to Koumjian JH and Nimmo A, bis-acryl materials demonstrate 85% decrease in transverse strength after repair [16]. They suggested that it may be useful to make a new provisional restoration than repairing this material. During repair, a lack of chemical interaction between the fresh and the old material reduces the fracture toughness of these materials. Bohnenkamp DM stated that because of dissimilar chemistry, flowable composite do not readily bond to the bis acrylic material, making repair and modification difficult [23]. The chemically activated PMMA have an edge over the bis-acrylic composites. The increase in strength may be because of the concomitant effects such as interpenetration among the new and the old resins.
Repair width and bevel are also relevant factors contributing to the distribution of stresses in the repaired specimens. Leong A and Grant AA reported that at a 2mm gap reduced the deflection of specimens tested by 20% when compared with 3mm gap specimens [24]. Moreover, it also decreased the degree of polymerization contraction and colour difference between the two fractured parts and the repair material. As in literature, 2mm gap was the most commonly suggested, the same was created for the repair material in the present study. A 450 bevel was made on the fractured end of the broken sample. Ward JE et al., suggested a 450 bevel and rounded surface designs for the repair surface [25]. The advantage was to increase the interfacial bond area and shift the interfacial stress pattern more towards a shear stress and away from more damaging tensile stresses.
Summary
Three poly methyl methacrylate based materials (DPI, SC10 and Trulon) and three bis-acrylic based composite resins (Protemp, Coooltemp, Luxatemp) were chosen. A total of 72 specimens were prepared and were divided into two groups and two sub-groups. All samples were tested for flexural strength at 24 hours and 8 days’ time interval by using universal testing machine. The fractured samples from the 8 day study were then subjected to repair and tested. Results were recorded and compared by one way Anova and Post hoc tests. Results showed that the flexural strength of poly methyl methacrylate and bis-acrylic resins is similar at both time intervals. However a substantial decrease is noticed in the strength of bis-acrylic composite resins after repair.
Limitation
The present was an in-vitro study, although the provisional restorations are meant to function in the oral cavity. Also, other properties like color stability, micro-hardness, polymerisation shrinkage, marginal adaptability and absorption need to be further investigated to help the clinician choose the best material.
Conclusion
Within the limitations of this study following conclusion can be drawn. At 24 hour interval, the difference between the flexural strength of all the materials was insignificant. However, the highest flexural strength was exhibited by Protemp, a bis acrylic composite resin material. A highly significant decrease in flexural strength was seen for all the materials (both PMMA based and bis-acrylic based materials) from 24 hours to 8 days, though no difference in strength was seen between the materials at 8 days except SC10 which displayed a significant decrease in the flexural strength at this time interval. A highly significant difference in flexural strength was noted between both the groups, PMMA and bis-acrylic materials after repair. Bis-acrylic composite resins demonstrated a significant reduction in the flexural strength values as compared to the PMMA based materials when they were subjected to repair. From the current study it can be suggested that though there is decrease in flexural strength for all the materials from 24 hours to 8 days, both can be used to fabricate the provisional restorations. However, in the event of a fracture of a bis-acrylic provisional restoration, it may be more advantageous to make a new provisional restoration than to repair the fractured one.