Platelets are tiny, disc-shaped, non-nucleated, flattened structures, 1-4 μm in diameter. They are derived from cytoplasm of megakaryocytes and are well influenced by the patient’s general health and nutritional status [1]. Around 65% of platelets are smooth; disc shaped inert cells whereas the remaining 10-35% are less clearly defined cells (spherical platelets) [1]. The morphological differences that exist in platelets have important implications for measuring platelet size and assessing the functional expressions of platelets [2]. The differences in platelet volume vividly correlates with differences in density, dense body content, enzymatic activity of lactate dehydrogenase, platelet aggregation to adenosine di-phosphate and serotonin uptake and release, supporting the relevance of the Mean Platelet Volume (MPV) as a measure of platelet function [3].
Generally, the normal platelet count varies between 150,000 and 400,000/μl and normal platelet size (mean platelet volume) varies between 7.5 and 10.5 fl [4]. Some authors state that there is no significant difference among age groups regarding MPV in healthy individuals [5] whereas, some other studies show a slight increase in MPV as age increases in both males and females [6]. Few other studies support the idea that young platelets, presumably those that were recently released from the bone marrow were larger, denser and exhibited some alterations in function as compared to smaller platelets [4]. The size of the platelets depends largely on the density of the granules present in them [4]. The electron microscopy reveals the presence of glycogen as well revealed prominent masses in platelets [4]. Infact, the major source of energy for platelets is usually glucose which is rapidly taken from plasma [4]. Even during the critical period of platelet stimulation by agents that induce aggregation and release, it is associated with marked increase in metabolic activity involving glycogenolysis as well as with glycolysis and oxidation [4]. Under basal conditions, 40% to 50% absorbed glucose is used for glycogen production [4]. Platelet size (MPV) has become an important marker (and possibly a determinant) of platelet function and also a physiological variable of haemostatic importance [7].
Diabetes Mellitus is increasingly affecting the population across the world and is a complex metabolic syndrome characterized by chronic hyperglycaemia resulting in complications affecting almost all the organs of the body [8]. DM is classified into two types, Type 1 DM which is characterized by severely reduced insulin levels affecting mostly the young individuals and Type 2 DM characterized by insulin resistance which has higher incidence in adults [9]. Diabetes is fast gaining the status of a potential epidemic in India with more than 62 million diabetic individuals currently diagnosed with the disease [9]. It is predicted that by 2030, 79.4 million individuals may be afflicted with diabetes in India [10]. Type-2 DM is considered as a lifelong disease which increases morbidity, mortality and decreases the quality of life [10]. The disease and its complications also cause a heavy financial burden on diabetic patients, their families and society [10]. This is especially true in a developing country like India [10]. MPV may be used to overcome these challenges as it is a good indicator and independent predictor for various microvascular and macrovascular complications of Type 2 DM [11]. Patients with type 2 DM have been reported to have altered platelet morphology and function with an elevated MPV [11]. The increase in MPV occurs due to diabetic state per se when other causes are ruled out and persist for its duration [12]. Large sized platelets contain more dense granules, secrete more serotonin and beta thromboglobulin and produce more TXA2 than smaller platelets. Such large platelets are more reactive and aggregable and can lead to vascular complications [12].
Based on the levels of Glycosylated Haemoglobin (HbA1c) in the blood, American Diabetic Association has classified Type-2 Diabetes Mellitus patients as uncontrolled group of diabetic patients whose HbA1c level is maintained more than 7% and as controlled group of diabetic patients whose HbA1c level is maintained less than or equal to 7% [13]. This study aimed to estimate the Mean Platelet Volume in Type-2 Diabetes Mellitus (DM) patients of uncontrolled group and controlled group and in non-diabetic healthy people and to establish correlations between them.
As diabetic retinopathy is one of the most common microvascular complications of diabetes mellitus and MPV measurements in various studies have been reported to be very high in these individuals, fundus examination has been performed in this study to certain number of uncontrolled group and controlled group of diabetic patients to detect the presence of diabetic retinopathy and to draw any correlation with MPV.
Materials and Methods
This was a case control study carried over a period of one year in our institution. The ethical clearance from the Institutional Human Ethics Committee was obtained before starting the study. Type-2 Diabetic patients and non-diabetic healthy people were evaluated for the study. Informed Patient Consent was obtained before clinical examination. Thorough history taking and clinical examination were done to rule out other compounding causes and factors affecting MPV (selection criteria). Patient’s proforma was maintained which included all demographic particulars, past medical, surgical, drug, personal and family history. The patients were grouped as uncontrolled group of diabetic patients and controlled group of diabetic patients based on their HbA1c levels. A total of 106 uncontrolled diabetic patients and 100 controlled diabetic patients were included, with 100 non diabetic subjects as controls. Fundus examination was done and other ophthalmology findings were recorded for 50 uncontrolled diabetic and 50 controlled diabetic individuals.
Selection Criteria
Patients above 25 years of age and diagnosed with Type 2 Diabetes Mellitus and sub grouped based on American Diabetic Association Criteria (2013) [13] as having either Controlled Diabetes with HbA1c ≤ 7% or Uncontrolled Diabetes with HbA1c > 7% were included in this study as cases. Healthy non-diabetic controls were selected based on their fasting and post prandial blood glucose levels as per the American Diabetic Association Criteria. The fasting blood glucose level was required to be in the range of 70-100 mg /dl and the post prandial blood glucose level should be ≤ 140 mg/dl.
Patients suffering from anaemia or any bone marrow disorders, ischemic heart disease, dyslipidemia, chronic systemic inflammatory disorders, patients with renal failure, smokers, patients suffering from thyroid-related disorders, having any infectious diseases, AIDS, sepsis, pregnant women, patients on anti-platelet drugs and cancer chemotherapy were excluded from the study owing to their effect on MPV [5].
Procedure
In both the controlled and uncontrolled groups of diabetic patients, 3ml of venous blood was collected in each of the two K2-EDTA filled plastic vacutainer tubes by venipuncture under aseptic precautions, from the antecubital vein for estimating MPV and HbA1c. For MPV estimation, one of the two vacutainer was placed in Coulter LH-780 haematology analyser and MPV was computed.
For HbA1C estimation, the other vacutainer was placed in High Pressure Liquid Chromatography analyser, BIORAD and HbA1c was computed.
For the diagnosis of retinopathy in uncontrolled group and controlled group of diabetic patients, fundus examination was done in certain patients using Welch Allyn Direct ophthalmoscope after they were subjected to the slit lamp examination of both the eyes. Diagnosis of Diabetic Retinopathy was made and any other ophthalmic findings were also recorded.
Statistical Analysis Procedure
The findings were analysed statistically using IBM SPSS software. Arithmetic mean and standard deviation was calculated from our data. Then mean values of patient and control groups were compared by student t-test. For subgroup analysis, one-way ANOVA test was used to determine whether a significant difference between groups exists. By reason of significant difference, an appropriate post-hoc test (Tukey-B test) was applied to compare the subgroups. Also, the mean and standard deviation of Age, MPV, HbA1c in separate genders (males and females) of uncontrolled DM, controlled DM and non-diabetic individuals and also independent sample t-test values and its significance were also calculated. Pearson co-relations and p-value were obtained for discussion.
Results
[Table/Fig-1] shows the mean and standard deviation values of Age, HbA1c, MPV in controlled, uncontrolled DM patients and in non-diabetic controls (HbA1c was excluded for this group). The ANOVA Test/‘F’ and t-test revealed a statistically significant difference between the two. In uncontrolled group of 106 Diabetic patients, 54 patients were males and 52 patients were females and the mean age was 51.63±11.04, mean HbA1c was 9.86±1.91% and mean MPV was 8.93±0.90fl. In Controlled group of Diabetic patients, 49 patients were males and 51 patients were females and the mean age was 47.88±15.17, mean HbA1c was 6.08±0.49% and mean MPV was 8.106 ±0.72 fl. In Non-diabetic controls 77 patients were males and 23 patients were females and the mean age was 37.97±9.69 and mean MPV was 8.02±0.86fl. The mean platelet volume of all the three groups like uncontrolled DM, controlled DM and non-diabetic controls have been depicted in a bar diagram [Table/Fig-2].
Mean and standard deviation values of Age, HbA1c, MPV in controlled, uncontrolled DM patients and in non-diabetic controls.
| Uncontrolled DM(n = 106) | Controlled DM(n = 100) | Non-diabetic(n = 100) | Tests of Significance |
|---|
| Mean | SD | Mean | SD | Mean | SD | Test Statistic and Value | p-value |
|---|
| Age | 51.63 | 11.04 | 47.88 | 15.17 | 37.97 | 9.69 | F Value: 34.303* | <0.001 |
| MPV | 8.93 | 0.90 | 8.1060 | 0.72 | 8.02 | 0.86 | F Value: 38.333* | <0.001 |
| HbA1C | 9.86 | 1.91 | 6.08 | 0.49 | . | . | t-Value: 19.170** | <0.001 |
‘*’ = ANOVA; ‘**’ = t-test
Mean platelet volume of the three groups– The Uncontrolled DM, controlled DM and non-diabetic controls.
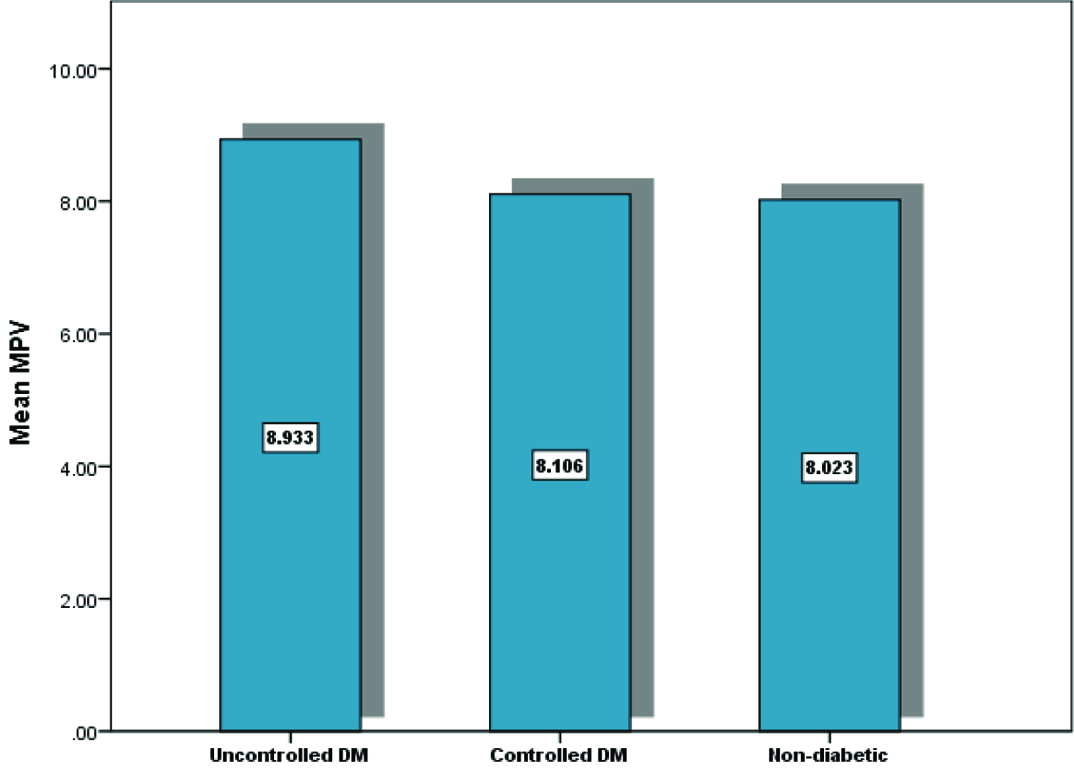
One-way ANOVA analysis revealed [Table/Fig-1] significant results (p<0.001). Therefore subsequent post-hoc tests (Tukey B tests) were performed, the results of which have been depicted in [Table/Fig-3]. The data on age and MPV of all the three groups obtained by post-hoc tests revealed that there was variation among age in all three groups and no variation between MPV in controlled DM and non-diabetic controls was observed whereas, MPV of uncontrolled DM subjects varied with the other two groups.
Post-hoc Test (Tukey-B Test).
| Age | MPV |
|---|
| Group | n | Subset for alpha = 0.05 | Subset for alpha = 0.05 |
|---|
| 1 | 2 | 3 | 1 | 2 |
|---|
| Non-diabetic | 100 | 37.97 | | | 8.0230 | |
| Controlled DM | 100 | | 47.88 | | 8.1060 | |
| Uncontrolled DM | 106 | | | 51.63 | | 8.9330 |
[Table/Fig-4] shows the mean and standard deviations of age, MPV, HbA1c values of both male and female genders belonging to the uncontrolled DM, controlled DM and non-diabetic individuals and also independent sample t-test values and its significance.
Mean and standard deviations of Age, MPV, HbA1c values of both male and female genders of uncontrolled DM, controlled DM and non-diabetic individuals and also independent sample t-test values and its significance.
| Uncontrolled DM | Controlled DM | Non-diabetic |
|---|
| Male | Female | Independent Samples t-test | Male (n=51) | Female | Independent Samples t-test | Male | Female | Independent Samples t-test |
|---|
| Mean | SD | Mean | SD | t Value | p-value | Mean | SD | Mean | SD | t Value | p-value | Mean | SD | Mean | SD | t Value | p-value |
|---|
| Age | 53.46 | 11.52 | 49.87 | 10.37 | 1.688 | .094 | 45.39 | 15.91 | 50.47 | 14.06 | -1.689 | .094 | 37.26 | 9.35 | 40.35 | 10.63 | -1.347 | .181 |
| MPV | 8.73 | .83 | 9.13 | .93 | -2.302 | .023 | 8.14 | .66 | 8.07 | .78 | .442 | .659 | 7.93 | .83 | 8.34 | .88 | -2.053 | .043 |
| HbA1C | 9.73 | 2.02 | 9.98 | 1.81 | -.667 | .506 | 6.03 | .53 | 6.13 | .45 | -.946 | .346 | . | . | . | . | | |
DM = Diabetes mellitus
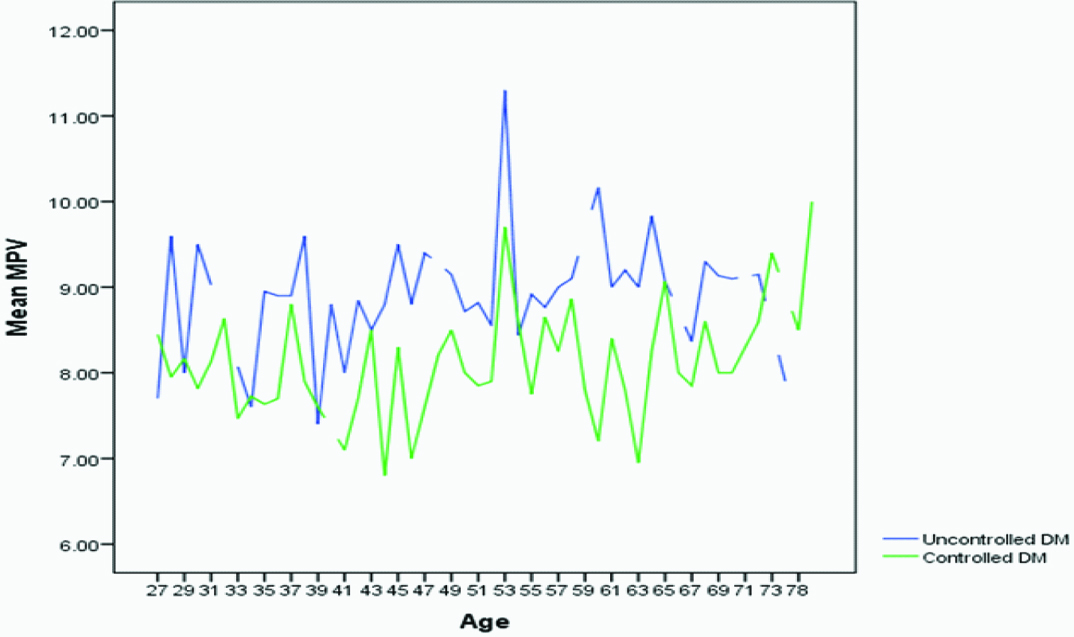
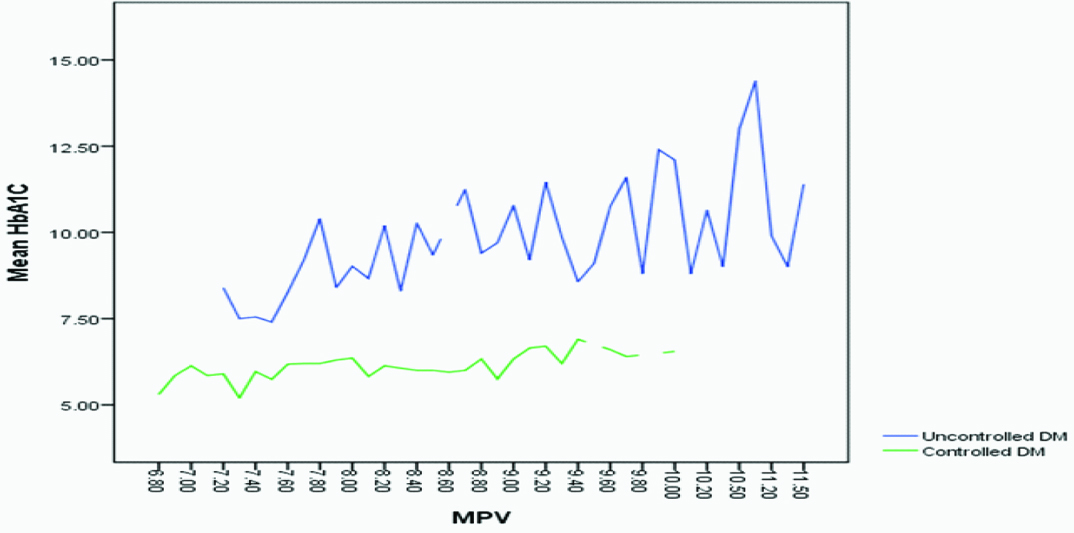
A line diagram [Table/Fig-5] illustrated that the MPV values of uncontrolled diabetes patients were much higher than the MPV values of controlled diabetic patients. Another line diagram [Table/Fig-6] showed that the MPV values of uncontrolled DM patients proportionally increased with HbA1c. Pearson co-relations and p-value [Table/Fig-7] were obtained between age and HbA1c, age and MPV, MPV and HbA1c in uncontrolled DM and controlled DM.
Comparison of the MCV values between the uncontrolled and the controlled diabetic group.
Line diagram showing the correlation between MPV and HbA1c in controlled and uncontrolled DM patients.
Pearson co-relation between Age and HbA1c, Age and MPV, MPV and HbA1c in controlled and uncontrolled DM patients.
| Group | Age | MPV | HbA1C |
|---|
| Uncontrolled DM | Age | 1 | .117 | .017 |
| MPV | .117 | 1 | .328** |
| HbA1C | .017 | .328** | 1 |
| Controlled DM | Age | 1 | .221* | .488** |
| MPV | .221* | 1 | .290** |
| HbA1C | .488** | .290** | 1 |
| Non-diabetic | Age | 1 | -.046 | . |
| MPV | -.046 | 1 | . |
**. Correlation is significant at the 0.01 level (2-tailed).
*. Correlation is significant at the 0.05 level (2-tailed).
Ophthalmology findings were obtained for 50 uncontrolled diabetic and 50 controlled diabetic individuals with their percentage occurrence of retinopathy complication were tabulated [Table/Fig-8]. Among 50 uncontrolled diabetic patients, 14 patients showed diabetic retinopathy whose average MPV was about 9.2±0.61fl and mean HbA1c of 10.6±1.98%, whereas 30 uncontrolled patients showed no evidence of retinopathy and their average MPV was about 8.39±0.676 fl and mean HbA1C of 9.18±1.91% [Table/Fig-9].
Percentage of uncontrolled and controlled DM patients with presence or absence of ophthalmic complications.
| Ophthalmic Complications | Group |
|---|
| Uncontrolled DMN=50 | Controlled DMN=50 |
|---|
| n | % | n | % |
|---|
| No Diabetic Retinopathy | 30 | 60 | 49 | 98 |
| Diabetic Retinopathy | 14 | 28 | 1 | 2 |
| Cataract | 6 | 12 | 0 | 0 |
Mean, Standard deviation and Variance values of HbA1c and MPV in uncontrolled diabetic patients with and without diabetic retinopathy.
| Uncontrolled DM with Diabetic retinopathy (n=14) | Uncontrolled DM with NO Diabetic retinopathy (n=30) |
|---|
| Mean | SD | Variance | Mean | SD | Variance |
|---|
| HbA1c | 10.6 | 1.98 | 3.93 | 9.18 | 1.91 | 3.64 |
| MPV | 9.2 | 0.61 | 0.37 | 8.39 | 0.676 | 0.456 |
Discussion
We could clearly see from our study [Table/Fig-1,2] that the MPV was significantly elevated in uncontrolled DM (8.93±0.90fl) as compared to MPV in controlled DM (8.106 ±0.72 fl) and non-diabetic controls (8.02±0.86fl) which coincides with the results of Kodiatte et al., Zuberi et al., Sharpe et al., Papanas et al., Hekimsoy et al., Demirtunc et al., Jindal et al., and Vernekar et al., Zaccardi et al., Dindar et al., but contradicts the results of Unübol et al., [8,9,11,14–22].
In our study, post-hoc tests (tukey B tests) revealed that there was no variation between MPV in controlled DM and non-diabetic controls and only MPV of uncontrolled DM got varied with the above two groups. The post-hoc tests also revealed that there was variation among age in all three groups. In this study, age matched case control data was not stressed upon, since certain studies have elicited that either no significant difference among age groups regarding MPV in healthy individuals [5], or only a slight increase in MPV as age increases in both males and females [6].
This increase of MPV in uncontrolled DM could be justified based on few of the following hypothetical theories. Major source of energy for platelets is glucose which is rapidly taken from plasma [4]. Under basal conditions 40% to 50% absorbed glucose is used for glycogen production [4]. The presence of glycogen is well revealed as prominent masses in platelets in electron microscopy studies [4]. Type 2 DM is characterized mainly by impaired insulin secretion and increased tissue insulin resistance with sustained hyperglycaemia [8]. Due to chronic hyperglycaemia, platelets are overwhelmed with glucose and platelets are subjected to synthesis of glycogen and glycosylation of certain proteins. The increased glycogen content in turn contributes to small percent of increase in the size of the mean platelet volume [23]. One other theory to support increase of MPV in high glycaemic patients could be osmotic swelling due to raised levels of some glucose metabolites [12]. The third theory about the raised MPV in uncontrolled DM may be the reflection of higher turnover [12].
There is also hyper-reactivity of platelets and increased baseline activation in diabetic patients due to many biochemical factors such as hyperglycaemia, hyperlipidemia, insulin resistance, prolonged inflammatory and oxidant state and also with increased expression of glycoprotein receptors and growth factors [8]. Hyperglycaemia increases platelet reactivity by increasing nonenzymatic glycation of proteins on the platelet surface, and also by the osmotic effect of glucose [24–26]. Such glycation decreases membrane fluidity and increases the activation of platelets. Insulin directly controls the platelet function via a functional Insulin Receptor (IR) present on the surface of human platelets [24–26]. It was proved in vivo experiments that insulin inhibits platelet interaction with collagen and weakens the platelet aggregation effect of agonists in healthy nonobese individuals [24–26]. Overall, a prolonged hyperglycaemic state leads to various microvascular and macrovascular complications and the platelets add up these effects [12,26].
In our study [Table/Fig-4], ratio between male and female gender in both uncontrolled DM and controlled DM was nearly equal to 1 but the ratio was not the same in non-diabetic controls. From the [Table/Fig-4] we also infer that in both uncontrolled DM group and non-diabetic individuals, mean MPV level was significantly higher in women than men Whereas, mean MPV level in controlled DM patients were higher in men than women. Other researchers namely Park et al., Bain et al., Bancroft et al., have found no statistically significant differences in MPV between women and men [27–29].
Our study showed that HbA1c is not proportional to MPV in each and every patient and it was in accordance with studies conducted by Kodiatte et al., and Papanas et al., [8,15]. But overall it was seen that average level of MPV values [Table/Fig-5] of uncontrolled DM is well above the values of MPV of controlled DM patients as marked against their respective ages. [Table/Fig-6] clearly illustrated that MPV values of uncontrolled DM patients proportionally increased with HbA1c.
A positive co-relation of 0.290 and 0.328 [Table/Fig-7] between MPV and HbA1c was observed in controlled DM and uncontrolled DM patients respectively which yielded a significant p-value of 0.01 and it coincides with the results of Kodiatte et al., (p=0.01), Papanas et al., (p=0.01), Demirtunc et al., (p=0.01), and Jindal et al., (p<0.05) [8,15,17,18]. We also obtained significant co-relation between HbA1c and age, MPV and age in controlled DM patients (p=0.01, p<0.05 respectively). This significant correlation helps us to prove that MPV is increased for those with chronic hyperglycaemia. But we did not get a significant correlation between age and HbA1c in uncontrolled DM cases which state that age is not a factor to influence the HbA1c values. This is supported by a Latin American study which states younger adult patients with diabetes often had poorer glycaemic control (HbA1c) than older patients [30].
Our secondary objective was to investigate the association between the mean values of MPV and microvascular complication like retinopathy in diabetic patients. As mentioned in [Table/Fig-8], out of 50 uncontrolled DM patients, 30 patients (60%) didn’t have retinopathy, 14(28%) had diabetic retinopathy and 6(12%) had cataract whereas in 50 controlled DM patients, 49(98%) didn’t have retinopathy and only 1(2%) had diabetic retinopathy. As the data obtained in our study was insufficient for a statistical analysis by SPSS, we have only obtained arithmetic mean of MPV in uncontrolled DM and controlled DM patients with diabetic retinopathy. As depicted in [Table/Fig-9] the mean MPV in uncontrolled DM patients with diabetic retinopathy was 9.20±0.61fl and mean MPV in uncontrolled DM patients with no diabetic retinopathy was 8.39±1.98fl that coincides with the results found in Papanas et al., Dindar et al., and Ates et al., [15,21,31]. This finding clearly suggests a role for both chronic hyperglycaemia and increased volume of platelets in the pathogenesis of retinopathy. Various factors influence the pathogenesis of microvascular complications in sustained hyperglycaemic patients. The basic mechanisms in diabetic complications include formation of advanced glycation end products, activation of protein kinase C and disturbances in polyol pathways [32]. As MPV is seen increased in diabetes mellitus patients, there is presence of larger platelets which are younger, more reactive, aggregable, contain denser granules and they also secrete more serotonin, β-thromboglobulin, and thromboxane A2 than smaller platelets [12,33,34]. All these can produce a pro-coagulant effect and cause thrombotic vascular complications. This suggests a relationship between MPV and diabetic vascular complications like varying stages of retinopathy. Thus, platelets with increased MPV may assume an important role in signaling of the development of retinopathy and other vascular complications in diabetes mellitus cases.
Conclusion
From the results, we conclude that the Mean Platelet Volume remains increased and high in uncontrolled DM patients when compared to controlled DM patients and healthy non diabetic people. Also, there is a strong co-relation between Mean Platelet Volume and HbA1c especially in uncontrolled diabetic group. We also conclude MPV is more elevated in patients with microvascular complications like diabetic retinopathy suggesting that MPV in diabetes patients could play a more important role in the development of vascular complications. Sufficient number of patients could not be examined for determining the prevalence of retinopathy in controlled and uncontrolled groups. Since the sample size was too small to be tested statistically, a hypothesis cannot be made for the same. Diabetes is fast gaining the status of a potential epidemic in India and by investigating MPV in uncontrolled DM patients we can caution them and suggest them to reduce their high glycaemic level to a state of controlled DM category (HbA1c<7) and thereby we can minimize the process of complication. Mean platelet volume and HbA1c together can be used as important indicators to monitor those patients developing microvascular and macrovascular complications of Type 2 DM.
‘*’ = ANOVA; ‘**’ = t-test
DM = Diabetes mellitus
**. Correlation is significant at the 0.01 level (2-tailed).
*. Correlation is significant at the 0.05 level (2-tailed).