With the dramatic increase in the amount of scientific information available about oral health, an evidence-based approach to oral health care and the practice of dentistry is the need of hour. Knowledge of the patient’s health history and susceptibility to oral disease puts the dentist in the best place to make treatment decisions in the finest interest of the patient. Consequently, clinical reference must be balanced with the clinicians’ professional proficiency and the patient’s preference [1]. Every dentist must deliver highest quality of treatment to individual patients and apply advances in science and technology to continually improve the oral health.
Dental caries is a progressive, cumulative oral disease which becomes more intricate to treat with advancement [2]. It is a major oral health problem across various countries. In India, prevalence of dental caries is 31.5-89% which indicates it to be a major public health problem posing a great challenge to community and dental professionals [3]. But intervention at primary level can reduce this problem. Primary prevention is by means of community fluoridated water supplies, professional fluoride treatments and pit and fissure sealants etc., [2]. Fluoride has already established its role in preventive dentistry and use of fluoride in the form of toothpastes, mouth rinses, gels, and varnishes have been extensively documented and discussed [4]. The most efficient method to reduce occlusal caries that has been in practice since a long time, is pit and fissure sealants. Over the last four years, more than 11 guidelines and systematic reviews have been conducted that have recommended this treatment modality to be used for population [5–16].
Scientific evidence also favours use of caries preventive agents in children but for this to be effective, the knowledge must be transferred to practice, so that community is benefitted. But there is lack of multi-region data for comparison of knowledge, attitude and practice patterns of dental practitioners. In order to execute a successful preventive practice, there is need of a better understanding of practice pattern that will help in targeting the continuing education by professional dental associations as well as encouraging evidence-based utilization of different preventive therapies [17].
Therefore, this study examined Knowledge combined with Attitude and Practice (KAP), as a first step toward initiating comprehensive caries prevention program in Bhopal city (Madhya Pradesh State-central part of India). More particularly, this study assessed dentists in the Bhopal city regarding the use of pit and fissure sealants and topical fluoride. The results obtained from the study may highlight the need to apply diverse methods used in preventive dentistry.
Materials and Methods
A descriptive cross-sectional study was conducted at Department of Paedodontics, Rishiraj College of Dental Sciences, Bhopal, Madhya Pradesh, India, using a 20-item self-administered, closed ended questionnaire. Around 200 available private general dental practitioners of Bhopal (within city limits) made up the (convenient) sampling frame of the study. Regarding the sample identification, the survey was done in 2015 and the sample size was identified and selected based on the approximate total number of dentists practicing in Bhopal city limits. The method of recruitment and sample selection was based on the database of Indian Dental Association (IDA) Bhopal branch booklet (2014 issue) containing the name, address and phone number of registered dental practitioner. All these dentists were identified and contacted. But out of 200 dentists, only 147 were surveyed, because others did not want to participate in study due to their busy schedule and other personal reasons. Informed consent was taken prior to participation in the study. Institutional ethical committee clearance was taken prior to the study. The data was collected from the questionnaire provided to the practitioners [Table/Fig-1]. The questionnaire consisted of three parts viz., 11 questions on knowledge, four questions on attitude and five questions on practice. Participants were asked several yes/no questions regarding their knowledge, attitude and practice pertaining to sealants, topical fluoride and other preventive measures. In addition, demographic data, such as the practitioner’s age, gender, and qualification were also ascertained from the questionnaire.
Distribution of scores for the questions
| Questions | Percentage |
|---|
| Yes | No |
|---|
| Knowledge |
| Do you know about use of pit and fissure sealants in children? | 85 | 15 |
| Do you know various contraindications for use of pit and fissure sealants? | 84.4 | 15.6 |
| Do you know about various commercially available pit and fissure sealant products? | 47.6 | 52.4 |
| Can sealant be placed on teeth immediately following a topical fluoride treatment? | 63.3 | 36.7 |
| Do you know about various age groups of topical fluoride application? | 97.3 | 2.7 |
| Do you know about use of topical fluorides? | 82.3 | 17.7 |
| Do you know about management of fluoride toxicity? | 78.9 | 21.1 |
| Do you know about various commercially available topical fluorides products? | 32.7 | 67.3 |
| Do you know about usage of space maintainer? | 90.5 | 9.5 |
| Do you know about various contraindications for use of space maintainer? | 89.8 | 10.2 |
| Do you know about various abnormal oral habits in children? | 94.6 | 5.4 |
| Attitude |
| Do you evaluate clinical success rate in Follow-up visits after pit and fissure sealants? | 24.5 | 75.5 |
| Do you educate your patients and their Parents about importance of fluoride? | 98.6 | 1.4 |
| Do you examine for different oral habits in children? | 99.3 | 0.7 |
| Do you refer your patients to paediatric dentist? | 77.6 | 22.4 |
| Practice |
| Do you give habit breaking appliances to children when indicated? | 27.2 | 72.8 |
| Do you give space maintainer after extraction when indicated? | 27.2 | 72.8 |
| Do you give myofunctional appliances in your routine dental practice, when indicated? | 28.6 | 71.4 |
| Do you use topical fluoride in your routine dental practice? | 40.8 | 59.2 |
| Do you use pit and fissure sealants in your routine dental practice? | 42.9 | 57.1 |
Test used: Frequency distribution
Questionnaire responses were tabulated using Microsoft excel and SPSS version 19.0. Statistical analysis was done for each of the 20 survey items and for each of the three assessment domains (Knowledge, Attitude and Practice), a frequency distribution as well as the mean was determined. These were evaluated individually using the chi-square test, t-test and Pearson’s correlation test.
Results
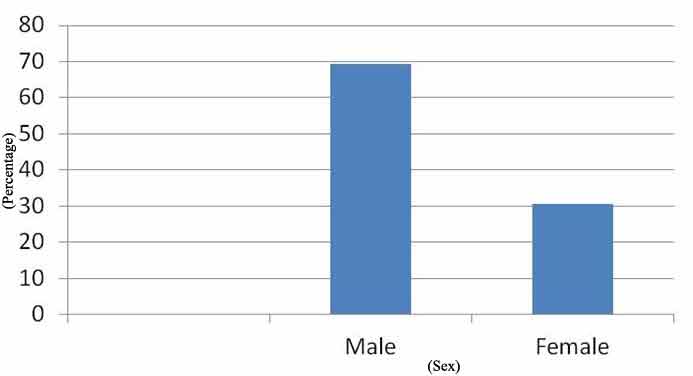
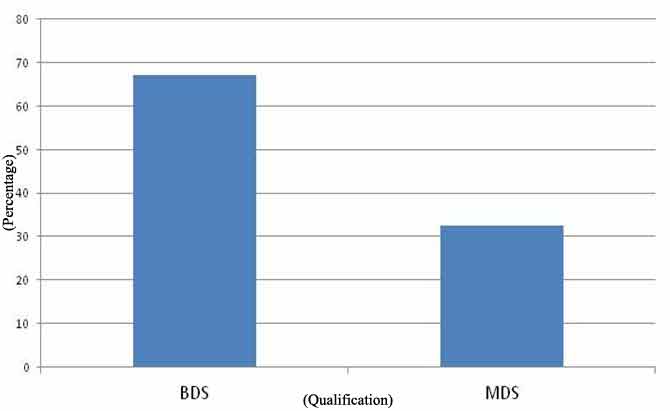
Out of 200 practicing dentists, 147 (73.5 %) participated in the study which is considered as a good response rate [18]. These were divided between male and female as 102 (69.4%) and 45(30.6%), respectively [Table/Fig-2]. According to age, 122 (83%) were below 35 years of age (Age group 1) while 25 (17%) were above 35 years of age (Age group 2) [Table/Fig-3]. Qualification distribution reveals 67.3 % as dental graduate (BDS) and 32.6% as dental specialist (MDS) [Table/Fig-4]. The distribution of scores for the questions in the three sections - knowledge, attitude and practice – is presented in [Table/Fig-1]. Distribution of Knowledge Score in relation to age, gender and qualification is presented in [Table/Fig-5]. Distribution of Attitude score in relation to age, gender and qualification is presented in [Table/Fig-6]. Distribution of Practice score in relation to age, gender and qualification is presented in [Table/Fig-7].
Gender distribution.
Frequency distribution
Age distribution.
Frequency distribution

Qualification distribution.
Frequency distribution
Knowledge in relation to age, gender and qualification.
| Questions | Age | Gender | Qualification |
|---|
| <35Yrs Group.1 | > 35Yrs Group 2 | p-value | M | F | p-value | BDS | MDS | p-value |
|---|
| 1. | Yes | 90.2 | 60 | 0.001*(HS) | 84.3 | 86.7 | 0.712 | 85.1 | 84.8 | 0.973 |
| No | 9.8 | 40 | 15.7 | 13.3 | 14.9 | 15.2 |
| 2. | Yes | 89.3 | 60 | 0.001*(HS) | 84.3 | 84.4 | 0.984 | 84.2 | 84.8 | 0.929 |
| No | 10.7 | 40 | 15.7 | 15.6 | 15.8 | 15.2 |
| 3. | Yes | 46.7 | 52.0 | 0.630 | 52.0 | 37.8 | 0.113 | 43.9 | 60.6 | 0.090 |
| No | 53.3 | 48.0 | 48.0 | 62.2 | 56.1 | 39.4 |
| 4. | Yes | 64.8 | 56.0 | 0.408 | 58.8 | 26.7 | 0.093 | 65.8 | 54.5 | 0.20 |
| No | 35.2 | 44.0 | 41.2 | 73.3 | 34.2 | 45.5 |
| 5. | Yes | 98.4 | 8.0 | 0.070 | 98.0 | 95.6 | 0.394 | 96.5 | 100 | 0.275 |
| No | 1.6 | 92 | 2.0 | 4.4 | 3.5 | 0.0 |
| 6. | Yes | 82.8 | 80 | 0.73 | 82.4 | 82.2 | 0.985 | 86 | 69.7 | 0.03(SIG.) |
| No | 17.2 | 20 | 17.6 | 17.8 | 14 | 30.3 |
| 7. | Yes | 83 | 60 | 0.001*(HS) | 78.4 | 80 | 0.830 | 82.5 | 66.7 | 0.05(SIG) |
| No | 17.0 | 40.0 | 11.6 | 20.0 | 17.5 | 33.3 |
| 8. | Yes | 31.3 | 40 | 0.39 | 38.2 | 80.0 | 0.30 | 26.3 | 54.5 | 0.002*(HS) |
| No | 69.7 | 60.0 | 61.8 | 20.0 | 73.7 | 46.5 |
| 9. | Yes | 90.2 | 92.0 | 0.776 | 94.1 | 82.2 | 0.02(SIG.) | 91.2 | 87.9 | 0.564 |
| No | 9.8 | 8 | 5.9 | 17.8 | 8.8 | 12.1 |
| 10. | Yes | 95.9 | 60 | 0.001*(HS) | 89.2 | 91.1 | 0.70 | 89.5 | 90.9 | 0.80 |
| No | 4.1 | 40 | 10.8 | 8.9 | 10.5 | 9.1 |
| 11. | Yes | 99.2 | 72 | 0.001*(HS) | 94.1 | 95.6 | 0.70 | 93.9 | 97.0 | 0.48 |
| No | 0.8 | 28 | 5.9 | 4.4 | 6.1 | 3 |
* Denotes highly significant (HS) results
Test used: Chi square test
Attitude in relation to age, gender and qualification.
| Questions | Age | Gender | Qualification |
|---|
| < 35 Y | >35 Y | p- value | M | F | p- value | BDS | MDS | p-value |
|---|
| 12 | Yes | 23 | 32 | 0.338 | 25.5 | 22.2 | 0.671 | 22.8 | 30.3 | 0.378 |
| No | 77 | 68 | 74.5 | 77.8 | 77.2 | 69.7 |
| 13 | Yes | 98.4 | 100 | 0.519 | 98.0 | 100 | 0.330 | 98.2 | 100 | 0.433 |
| No | 1.6 | 0 | 2.0 | 0.0 | 1.8 | 0 |
| 14 | Yes | 99.2 | 100 | 0.650 | 100 | 97.8 | 0.131 | 100 | 97 | 0.062 |
| No | 0.80 | 0 | 0 | 2.2 | 0 | 3 |
| 15 | Yes | 44.3 | 44 | 0.695 | 44.1 | 42.2 | 0.831 | 42.1 | 48.5 | 0.515 |
| No | 55.7 | 56 | 55.9 | 57.8 | 57.9 | 51.5 |
Chi square test
Practice in relation with age, gender and qualification.
| Questions | Age | Gender | Qualification |
|---|
| < 35 Y | >35 Y | p- value | M | F | p- value | BDS | MDS | p-value |
|---|
| 16 | Yes | 27 | 28 | 0.922 | 30.4 | 20 | 0.912 | 24.6 | 36.4 | 0.180 |
| No | 73 | 72 | 69.6 | 80 | 75.4 | 63.6 |
| 17 | Yes | 27.9 | 24 | 0.692 | 28.4 | 24.4 | 0.617 | 28.1 | 24.2 | 0.663 |
| No | 72.1 | 76 | 71.6 | 75.6 | 71.9 | 75.8 |
| 18 | Yes | 26.8 | 40 | 0.165 | 31.4 | 22.2 | 0.238 | 26.3 | 36.4 | 0.263 |
| No | 73.2 | 60 | 68.6 | 77.8 | 73.7 | 63.6 |
| 19 | Yes | 37.7 | 56 | 0.09 | 48 | 24.4 | 0.007 | 40.4 | 42.4 | 0.831 |
| No | 62.3 | 44 | 52 | 75.6 | 59.6 | 57.6 |
| 20 | Yes | 41.8 | 48 | 0.568 | 52 | 32.8 | 0.001* | 41.2 | 48.5 | 0.458 |
| No | 58.2 | 52 | 48 | 77.2 | 58.8 | 51.5 |
* Denotes highly significant results
Chi square test
The mean±SD were found for Knowledge as 8.46±1.82, Attitude as 2.65±0.780, and Practice as 1.66±1.57. When there was comparison of Knowledge in relation to age distribution, mean was found to be 8.71±1.55 for age less than 35 years and 7.24±2.5 for age more than 35 years and results were found to be highly significant (p=0.001). Comparison of knowledge in relation to gender, mean was found to be 8.54±1.84 for male and 8.29±1.79 for females, showing higher knowledge among males but difference found to be non-significant (p=0.44) [Table/Fig-8].
Summary table for knowledge, attitude and practice.
| KnowledgeMean±SD | AttitudeMean±SD | PracticeMean±SD |
|---|
| Age |
| <35 yrs | 8.71±1.55 | 2.65±.760 | 1.61±1.57 |
| ≥35 Yrs | 7.24±2.5 | 2.72±.891 | 1.96±1.56 |
| t-test val. | 3.84 | 0.422 | 1.024 |
| p-value | 0.001* | 0.674 | 0.307 |
| Gender |
| Male | 8.54±1.84 | 2.68±0.786 | 1.90±1.59 |
| Female | 8.29±1.79 | 2.62±0.777 | 1.13±1.39 |
| t-test val. | 0.765 | 0.387 | 2.796 |
| p-value | 0.44 | 0.699 | 0.006 |
| Qualification |
| BDS | 8.54±1.88 | 2.63±0.779 | 1.6±1.544 |
| MDS | 8.52±1.64 | 2.76±0.792 | 1.88±1.673 |
| t-test val. | 0.187 | 0.815 | 0.88 |
| p-value | 0.85 | 0.41 | 0.38 |
* Denotes highly significant results
Student’s t-test
Comparing Attitude in relation to age, mean was found to be 2.65±0.760 for age less than 35 years and 2.72±0.891 for age more than 35 years showing more favourable attitude for latter age group but difference found to non-significant (p=0.674). Comparison of attitude in relation to gender, mean was found to be 2.68±0.786 for males and 2.62±0.777 for females, showing higher knowledge among males but difference found to be non-significant (p=0.699) [Table/Fig-8].
Comparing Practice in relation to age, mean found to be 1.61±1.57 for age less than 35 years and 1.96±1.56 for age more than 35 years showing more favourable attitude for latter age group but difference found to non-significant (p=0.307). Comparing Practice in relation to gender, mean was found to be 1.90±1.59 for males and 1.13±1.39 for females, showing higher Knowledge among males and difference was found to be nearly significant (p=0.006) [Table/Fig-8].
The correlations between Knowledge, Attitude and Practice are presented in [Table/Fig-9]. Statistically significant correlations were found between attitude and practice (r=0.58, p=0.00) [Table/Fig-9].
Relationship between mean knowledge, attitude and practice.
| Knowledge | Attitude | Practice |
|---|
| Knowledge |
| Pearson’s correlation | 1 | 0.005 | 0.090 |
| Sig. (2-tailed) | | 0.948 | 0.279 |
| N | 147 | 147 | 147 |
| Attitude |
| Pearson’s correlation | 0.005 | 1 | 0.588 |
| Sig. (2-tailed) | 0.948 | | 0.000** |
| N | 147 | 147 | 147 |
| Practice |
| Pearson’s correlation | 0.090 | 0.588 | 1 |
| Sig. (2-tailed) | 0.279 | 0.000** | |
| N | 147 | 147 | 147 |
** Correlation is significant at the 0.01 level (2-tailed).
Pearson’s correlation test
Discussion
In surveys of professional groups, response rate of 60–80% is generally obtained [18]. Response rate in this study was found to be 73.5 % which is well within this range; others did not show interest in study due to their busy practice. In a report by ADA [15], clinical recommendations for sealants, topical fluorides [4,19] and other preventive measures should be in collaboration with the general practitioner’s professional judgment and the patient’s needs and preferences. As a preventive measure, sealants and fluorides are one of the best ways to prevent the initiation and progression of dental caries. Current research indicates good knowledge, favourable attitude towards them but underutilization in clinical practice. When comparing knowledge in relation to age distribution, dentist under 35 years of age showed more vast knowledge towards different preventive measures. This might be due to different continuing dental education program and increased awareness among young population. But more than half of the dental practitioners lack information regarding various commercial sealants and topical fluorides available in the market [Table/Fig-1]. Attitude and practice in found to be more favourable in age group 2 [Table/Fig-8]. When comparing Knowledge, Attitude and Practice in relation to gender, mean found to be higher for male than females showing higher value among male but difference found to be non-significant (p=0.44, 0.699, 0.006) [Table/Fig-8]. This may be due to smaller sample size. In relation to qualification, knowledge is comparable but attitude and practice showed higher values for postgraduate practitioners as compare to undergraduates (p=0.85, 0.41, 38) [Table/Fig-8]. This result shows the importance of training and specialization in the field.
As a whole, results indicate favourable knowledge and attitude but under utilization of sealants, topical fluoride and different preventive orthodontic practices, which do not appear to adequately relate practice behaviour. Similar results were found in study by Kervanto-Seppälä S [20] and a review [21] of clinical notes from 50 general dental practitioners in the United Kingdom, showing underutilization of sealants. These results were in contrary to the study carried out by Riley JL [17] who reported practice of sealants and topical fluoride as 69% and 82% respectively.
Limitation and Future Prospective
When practitioners were surveyed regarding referral of their patient to paediatric dentist, results indicate less favourable referral rate (77.6 %). This survey did not; however, determine the relationship of KAP to actual sealant, topical fluoride use and different preventive orthodontic consideration in children. A questionnaire study has its limits since most of the responses are self-reported and do not give exact information [21].
Area of concern is that there are some other factors in addition to knowledge and attitude which relates clinical practice. Some factors may be a difference in training that is given in dental school which is mainly concerned about basic knowledge and management of diseased tissue. It greatly differs from KAP in clinical training.
Dental caries is a critical concern even today and continues to plague majority of the world’s population with giant unmet treatment needs [22-23]. When to treat and when to refer to specialist, should be based on honest appraisal of skill levels [24]. Effective preventive strategies and fluoride revolution have catalyzed the process of evolution in caries management [25]. Statistics shows that in spite of vast knowledge and favourable attitude, preventive measures are less practiced. Thus, there is a need to implement knowledge in practice and understand the importance of healthy preventive practice. To achieve more specific and conclusive results, a large scale study with regional distribution should be carried out which will give a more clear picture and regions to be concentrated.
Conclusion
Regarding Knowledge, Attitude and Practice among dental practitioners in Bhopal city pertaining to sealants, topical fluorides usage and orthodontic considerations following conclusions can be drawn – viz., dentists in Bhopal city have vast knowledge towards preventive approach with sealants, topical fluorides and orthodontic consideration, and most of the dentists have a positive attitude towards this field. But they do not carry out most of the practices involved in preventive dentistry related to sealants, topical fluorides and orthodontic consideration and this needs to be improved.
Test used: Frequency distribution
* Denotes highly significant (HS) results
Test used: Chi square test
Chi square test
* Denotes highly significant results
Chi square test
* Denotes highly significant results
Student’s t-test
** Correlation is significant at the 0.01 level (2-tailed).
Pearson’s correlation test