The American Diabetes Association (ADA) and World Health Organization (WHO) have recently approved the use of HbA1c for the screening and the diagnosis of diabetes [1-3]. Both organizations have suggested that the level of HbA1c ≥ 6.5% is considered as diabetes and the ADA has also suggested that the level of HbA1c between 5.7 to 6.4% is diagnostic of pre-diabetes [1].
SH is defined as a condition with elevated serum levels of TSH and normal serum concentrations of thyroid hormones, T4 and T3 by the absence of clinical signs and symptoms [7]. SH is more common in the elderly and is found more prevalent in women than in men [8,9].
The present study was conducted with the aim to measure the levels of HbA1c in the subjects of SH without diabetes, that is, those having FBS < 110 mg/dl and to assess the effect of SH on HBA1c level in non-diabetic patients.
Materials and Methods
This study was a case-control study, conducted in the Biochemistry Department at Pramukhswami Medical College, Karamsad during August-2014 to August-2015. Two hundred individuals were considered for the study, 100 each in case and control group. Sample size of 200 was enough for this study. In absence of specific regional data of normal individuals, we used previously published data from two studies to estimate SD of HbA1c [10,11]. Considering SD in HbA1c to be 0.35 and difference of 0.15% in the means as clinically important, we required a sample of 87 per group. Allowing for 10% extreme outliers, a sample size of 100 per group was decided.
Inclusion Criteria for the case group was, serum TSH between 4.2 to 10 mU/L and for the control group was, serum TSH between 0.27 to 4.2 mU/L and for both the groups FBS level less than 110 mg/dl, Hb more than 10 g/dl and vitamin D3 more than 50 nmol/L.
Exclusion Criteria for both the case and the control groups were patients with known diabetes, liver diseases, renal diseases, haematological malignancies, patients with history of haemoglobinopathy, recent blood transfusion and patients on thyroxin supplements.
Written informed consents were obtained from all the participants, and then complete history was taken. Fasting blood samples were collected with an aseptic blood collection technique by the use of sterile gloves and thorough disinfection of venepuncture site with 70% ethyl alcohol. All the samples were collected in sitting position. Samples were centrifuged within one hour at 1500 rpm for 15 minutes. These would be processed to obtain serum/plasma for the estimations of FBS, HbA1c, Thyroid function tests (TFT), and Vitamin D3.
FBS was measured by enzymatic reference method with hexokinase [12] and HbA1c was measured by Immunoturbidimetry method standardized according to IFCC [13] in Cobas Integra 400 Plus clinical chemistry analyser, while serum TSH was measured by sandwich principle, and serum T3, T4, and vitamin D3 was measured by the competitive principle of Electro Chemiluminescence (ECL) method [14] in Cobas e-411 immunoassay analyser. Hb was measured by non-cyanide haemoglobin analysis method by Sysmex KX-21 Haematology Analyser [15]. Ethical clearance was obtained from Institutional Ethics Committee.
Statistical Analysis
All the data required for this study were collected and analysed statistically to determine the significance of different parameters by using the commercially available statistical software MedCalc version 14.8.1 and Microsoft Office 2016. All values were given as mean ± SD. Comparison between the case and the control groups were made using Student’s t-test (unpaired), and the p-value of less than 0.05 was considered statistically significant. Box and Whisker Plot and regression graph were presented for correlation between serum TSH and HbA1c.
Results
This study enrolled total 200 subjects, out of which 100 subjects were in the case group and 100 subjects were in the control group. All the subjects were of the age group of 21-70 years. [Table/Fig-1] shows the details of demographic data of the study. The mean age of the case group and the control group were 49.45±11.03 years and 48.28±11.27 years, respectively [Table/Fig-2]. Both the groups were statistically similar in the age with the p-value of 0.46. Both the groups (60 were females and 40 were males) were statistically similar to the gender distribution for females and males. So, there was no significant difference in the age and gender distribution between these two groups.
Demographic data of the case and the control groups.
| Age(years) | Case | Control | Total |
|---|
| Male | Female | Total | Male | Female | Total | Male | Female |
|---|
| 21-30 | 0 | 3 | 3 | 0 | 3 | 3 | 0 | 6 |
| 31-40 | 14 | 11 | 25 | 7 | 18 | 25 | 21 | 29 |
| 41-50 | 10 | 15 | 25 | 6 | 19 | 25 | 16 | 34 |
| 51-60 | 5 | 25 | 30 | 18 | 12 | 30 | 23 | 37 |
| 61-70 | 11 | 6 | 17 | 9 | 8 | 17 | 20 | 14 |
| Total | 40 | 60 | 100 | 40 | 60 | 100 | 80 | 120 |
Comparison of the various parameters in the case and the control groups. (The independent t-tests).
| Parameters | Case (Mean±SD) | Control (Mean±SD) | p-value* |
|---|
| Age (Year) | 49.45 ± 11.03 | 48.28 ± 11.27 | 0.46 |
| FBS (mg/dl) | 92.98 ± 4.95 | 93.76 ± 3.93 | 0.22 |
| Vitamin D3 (nmol/L) | 62.95 ± 12.42 | 63.46 ± 16.56 | 0.80 |
| Haemoglobin (gm/dl) | 13.21 ± 1.38 | 13.35 ± 1.64 | 0.52 |
| S. T3 (nmol/L) | 1.93 ± 0.36 | 1.89 ± 0.30 | 0.35 |
| S. T4 (nmol/L) | 106.68 ± 18.39 | 108.28 ± 18.01 | 0.54 |
| S. TSH (mU/L) | 5.90 ± 1.62 | 2.38 ± 0.79 | < 0.0001 |
| HbA1c (%) | 5.70 ± 0.35 | 5.26 ± 0.17 | < 0.0001 |
*p < 0.05 = Statistically Significant
Comparison of Variables by Student’s t-test:
Details of various characteristics of the case and the control groups are given in [Table/Fig-2]. There were no statistically significant differences between the case and the control groups for the fasting blood sugar, vitamin D3, Hb, serum T3 and serum T4 levels.
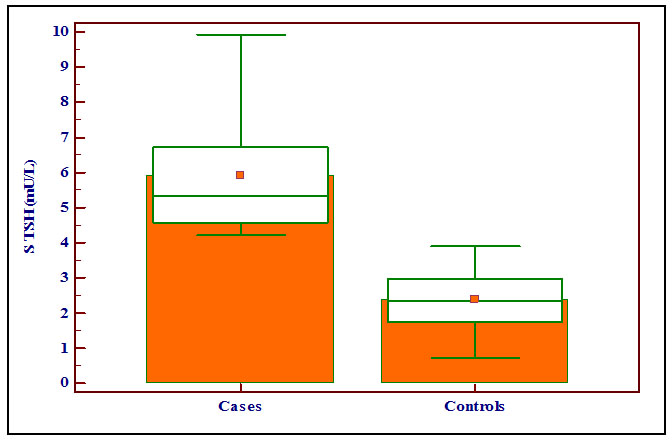
The mean serum TSH level was 5.90±1.62 mU/L and 2.38±0.79 mU/L in the case and the control groups, respectively. There was statistically significant difference with the p-value of < 0.0001 and the levels of S. TSH (mU/L) were significantly higher in the case group compared with the control group as shown in the Box and Whisker Plot [Table/Fig-3].
Showing the levels of serum TSH (mU/L) in the case and the control groups with box and whisker plot.
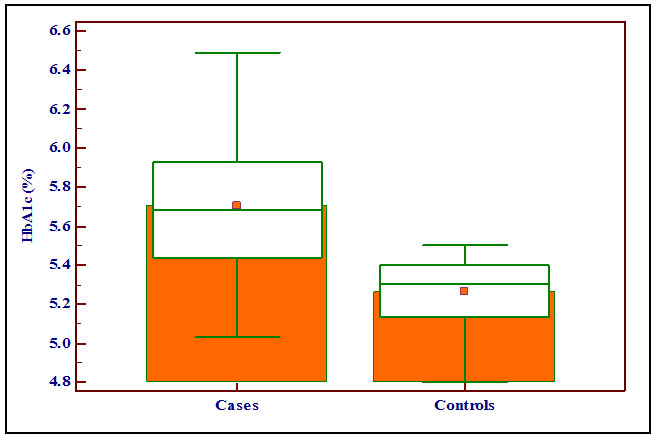
The mean HbA1c levels were 5.70 ± 0.35 % and 5.26 ± 0.17 % in the case and the control groups respectively. There was statistically significant difference with the p-value of < 0.0001. The levels of HbA1c (%) were significantly higher in the case group compared with the control group as shown in the Box and Whisker Plot [Table/Fig-4].
Showing the levels of HbA1c (%) in the case and the control groups with box and whisker plot.
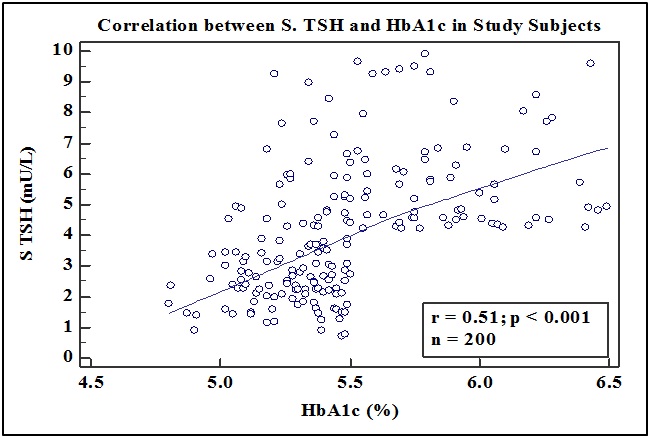
Correlation Between the Levels of Serum TSH and HbA1c:
We also found that there was a positive correlation between the levels of serum TSH (mU/L) and HbA1c (%) in all the participants of the study by Pearson’s correlation coefficient (r=0.51, p < 0.0001) [Table/Fig-5].
Showing the correlation between the levels of serum TSH (mU/L) and Hba1c in all the subjects of the study by pearson’s correlation coefficient. (r = 0.51, p < 0.0001).
Discussion
In the present study, the majority of the cases and the controls were seen in the age group of 31-60 years. The study also showed female predominance with 60% (120 out of 200) versus male, 40% (80 out of 200) of total participants.
The mean serum TSH level in the case group with SH and the control group was statistically significantly different (p < 0.0001). The levels of serum TSH were significantly higher in the case group which consists of subjects of SH compared with the control group comprising of normal healthy individuals. The mean HbA1c level in the case group and the control group was statistically significant (p < 0.0001). The levels of HbA1c (%) were significantly higher in the case group compared with the control group.
As there was no statistically significant difference between the case group with SH and the control group with normal healthy individuals for the age, sex, FBS, vitamin D3, Hb, serum T3 and serum T4 levels, the only difference in the case and the control groups were the levels of serum TSH. Also the levels of vitamin D3, serum T3, serum T4 and Hb were normal in both the groups. So, we can say that the levels of HbA1c in both the groups were not affected by age, sex, and the levels of FBS, vitamin D3, serum T3 and serum T4. S. TSH levels were significantly higher in the cases with SH than normal healthy individuals and the study result also showed that HbA1c levels were significantly higher in the cases than the controls.
In the study, we also found that there was statistically significant correlation between the levels of serum TSH and HbA1c in all the study subjects by Pearson’s correlation coefficient (r=0.51, p<0.0001). According to the above observations, we can say that the level of S. TSH was directly proportional to the level of HbA1c.
Pittas AG et al., showed that the higher vitamin D status, assessed by the plasma 25-hydroxy vitamin D concentration measured repeatedly during follow-up, was associated with a lower risk of incidence of diabetes among the people at high risk for the disease [16]. In a cross-sectional study of a general population sample in Eastern Finland, Hurskainen AR et al., observed an inverse association between the 25(OH)D3 levels and fasting insulin, fasting glucose and 2 hours’ glucose results, implying that low serum 25(OH)D3 may be associated with the impaired glucose metabolism [17]. Kostoglou-Athanassiou I et al., showed that the 25(OH)D3 levels were lower in the diabetes mellitus type 2 patients than the control group of normal healthy people [18]. Alzaim M and Wood RJ et al., showed that adequate vitamin D intake was related to a lower risk for the development of the gestational diabetes mellitus [19].
Hashimoto K et al., showed that the HbA1c levels were elevated in late pregnancy owing to iron deficiency and the HbA1c levels were negatively correlated with the MCH, serum transferrin saturation, and serum ferritin [20]. Cinemre H et al., showed that increase in the serum iron, haemoglobin, red blood cells, haematocrit, and serum ferritin levels were statistically significantly greater after treatment with iron plus levothyroxine group than only iron treatment group in the patients with coexisting iron-deficiency anaemia and subclinical hypothyroidism [21]. Studies of Cogan E et al., and El-Agouza I et al., showed that the HbA1c levels were higher in the patients with iron deficiency anaemia and decreased significantly upon treatment with iron. They also found that the elevated HbA1c levels in iron deficiency anaemia could be explained by the assumption that if the serum glucose remains constant, a decrease in the haemoglobin concentration might lead to an increase in the glycated fraction [22,23]. Koga M et al., showed that the erythrocyte indices are associated with the HbA1c independently of the plasma glucose levels, in the pre-menopausal women even when they are not anaemic [24].
Kim MK et al., study suggested that the HbA1c levels decreased after thyroid hormone replacement in the patients with overt hypothyroidism while, the serum Erythropoietin (EPO) level, reticulocyte count and MCH increased after thyroid hormone replacement, suggesting that thyroid hormone stimulates erythr-opoiesis. These data also suggest that the thyroid hormone replacement is associated with a decrease in the HbA1c level, which is influenced by increased erythropoiesis rather than by the changes in glucose level [6]. Christy AL et al., found that the non-diabetic hypothyroid individuals with anaemia showed the elevated HbA1c levels in prediabetes range and concluded that the elevated HbA1c in hypothyroidism can be attributed to anaemia [25]. Billic-Komarica E et al., also reported that the correlation between the level of serum TSH and HbA1c was positive and significant (r=0.46). SH independently increases the risk for decreased insulin sensitivity, especially in the adipose tissue and muscle. There is an apparent correlation between the SH and hyperinsulinemia and insulin resistance. SH and insulin resistance via its numerous mechanisms involved in the disruption of glycaemic control [26]. Al-Sayed A et al., investigate the correlation between insulin resistance and SH in Kuwaiti women and found that the insulin levels were significantly higher in the SH group comparable to the normal control [27]. Hardikar PS et al., found in their study that the MCH, MCHC and RDW were lower in the prediabetic and diabetic group classified on the basis of the HbA1C levels when compared to the normoglycaemic group [28].
From the above studies, we can say that there are different concepts related to the SH and the levels of HbA1c. Thyroid hormone replacement in the subjects with SH is associated with a decrease in the HbA1c level, which is influenced by the increased erythropoiesis leading to decreased the RBC life span, rather than due to the changes in glucose level. Some studies attributed anaemia for the elevated HbA1c in hypothyroidism. There is an apparent correlation between the SH and insulin resistance which is involved in the disruption of glycaemic control.
Limitation
The limitations of our study included the narrow subject selection, inability to measure the RBC lifespan, post prandial plasma glucose level, red cell indices and the effect of thyroid hormone replacement on erythropoiesis. These findings of our study need to be validated in the larger cohort.
Conclusion
For the adequate diagnosis of SH, serum TSH estimation is required to be done. The ADA has recently declared HbA1c ranging from 5.7 to 6.4% as indicative of pre-diabetes. According to these criteria, 47% of our case subjects (47 out of 100) are misclassified as having a pre-diabetic status.
Our data suggest that non-diabetic subjects with the SH show misleadingly high levels of HbA1c. The reasons for this might be due to the effect of thyroid hormones on altered erythropoiesis, reticulocyte count, and MCH or might be due to the association of insulin resistance in the subjects with SH. Due to the limitations of our study exact mechanism is not clear, and to find out the exact mechanism further studies are required. Therefore, the effects of the elevated levels of S. TSH on the HbA1c must be considered when interpreting the HbA1c for the diagnosis of diabetes or pre-diabetes in the subclinical hypothyroid patients.
*p < 0.05 = Statistically Significant