Introduction
Diet therapy is one of the corner stone’s in the management of diabetes. Keeping the blood sugar level as close to normal is the main focus of dietary management of diabetes. A typical Indian meal is largely composed of Carbohydrates (CHO). Consumption of staple cereals, forms the major source of CHO in the Indian diet. However, CHO metabolism is seen to be completely deranged in a person with type 2 diabetes. It is necessary to select the cereal which has lower postprandial glycaemic impact for subjects with compromised metabolic status. Preference between two main staple cereals rice and wheat as staple food, especially for diabetic group, will depend on the equi-quantity based postprandial glycaemic impact of these cereals.
Aim
To identify the cereals, better suited for individuals with diabetes (based on postprandial glycaemic and insulinemic impact of rice and whole wheat Indian flat bread i.e., chapatti).
Materials and Methods
After an overnight fast and upto 2 hours for every half an hour, finger tip blood samples for fasting and postprandial blood sugar was assessed. Venous blood for estimation of insulin levels were also collected from enrolled diabetic individuals and paired normal subjects. About 50 gm of test food like boiled rice, whole wheat chapatti and white bread as standard food were given on different occasions. Glucose and insulin levels were measured using glucometer and ECLIA method.
Results
Contrary to the popular belief, it was seen that rice exerted a lower peak and lower postprandial glycaemic and insulinemic response in both the study groups. Factors such as co-nutrient, moisture and fiber content all exert an impact on the postprandial glucose and insulin levels. With this the grain structure, particle size and amylose: amylopectin ratio are also important determinants.
Conclusion
When foods are considered as a whole and not a single nutrient, rice proves to be a better product for effective management of blood sugars in individuals with type 2 diabetes mellitus.
Glycaemic index, Indian staples, Insulinemic response, Whole wheat flat bread
Introduction
Carbohydrate (CHO) is the most important energy producing nutrient in the daily diet, but its digestion, absorption and metabolism in the body depends on its source, types of carbohydrate, co-nutrient present in the food and processing technique.
For long, selection of CHO rich food was done based on its Glycaemic Index (GI) value [1]. GI compares foods on equi-carbohydrate basis. It compares the postprandial glycaemic impact of equiquantity of carbohydrate from different test foods and standard food. Because the quantity of carbohydrate is different in different food, the total amount of food consumed to get equal quantity of CHO varies a lot. Therefore, comparison of two foods becomes difficult.
Typical Indian meal is rich in CHO where staple cereals contribute almost 60% of our daily energy. But the CHO metabolism is completely deranged in patients with diabetes mellitus. Dietary management in diabetic patients focuses to maintain blood sugar levels close to normal. This is achieved by mainly controlling the amount and type of CHO intake.
Therefore, it is important to classify food as a whole to understand their postprandial glycaemic impact. Glycaemic Index food (GIfood), [2] is a newer concept in this regard and compares postprandial impact of whole foods, including the CHO content, with the standard food on equi-quantity basis. GI compares the quality of CHO present in the selected food, whereas GIFood compares the impact of whole food, not only the CHO content of the food. This enables to determine the suitability of whole food with lower postprandial impact. GIfood values of common Indian starchy food have been analysed extensively in our laboratory and published in several peer reviewed journals [3–5].
Based on GI value, the most common staple of India, rice, associated with a high GI value, is generally seen to be restricted for people with diabetes and other metabolic disorders. On the other hand, Indian flat bread i.e., chapatti, made from flour of other important staple cereal, whole wheat, is favorably consumed for its low GI value.
However, several aspects of food such as the food structure, nutrient content, type of starch, type of cooking method, processing of food etc., also exert an impact over the glycaemic response of a food product and has not been accounted for, while determining the GI [3–7], as we do not consume CHO in isolation. Gl based on equal quantity of single nutrient as carbohydrate, may not suitable for comparing two products.
Recently, number of starchy foods have been assessed for their postprandial glycaemic impact and their demand of insulin to digest the same. The present report is comparing two common staple as to which cereal has lower postprandial glycaemic impact for subjects with compromised metabolic status, using the concept of GIfood, which is based on equi-quantity consumption of whole foods.
Materials and Methods
The study follows an experimental design and was done over a period of one and half month (June-July, 2013) after obtaining an ethical clearance from registered Ethics Committee.
After screening the latest blood sugar report of about 35 subjects, following the inclusion exclusion criteria, we could enroll n=8 subjects with type 2 diabetes for the study. Sample size was determined based on 80% power at a 5% of significance. Critical difference was considered as 20% variation in glycaemic values are large [8]. The inclusion criteria was outlined as: the maturity onset diabetic subject (n=8) at the age group of 45-65 years of both sexes, without complication, with blood HbA1c level< 8%, having comparatively stable sugar level with hypoglycaemic medicine. Paired normal subjects (n=6) were enrolled from family members of the diabetic subjects and a few of their other relatives who were age and BMI matched, gave consent to follow the experimental requirement, residing in the city of Mumbai, India, were enrolled for the study after receiving informed written consent. Subjects with unstable blood sugar levels, diabetes associated complication and other co-morbid condition and who were sick during the period of the study were excluded from the study.
Selected Food Sample
Two most commonly consumed staple Indian Foods, whole wheat-Indian flat bread- chapatti and boiled rice (SurtiKolam variety), were selected as the experimental foods. The test foods were prepared fresh every morning prior to the testing, following standardized procedure. White bread (Britannia Daily Fresh) was used as standard reference food.
Study Design
After overnight fasting, the subjects were given measured amount of whole food and asked to chew the given quantity of food thoroughly and finish within 10 minutes. About 100 ml water was given with each serving.
Blood Analysis
Finger tip capillary blood was used for the estimation of fasting and postprandial blood glucose using a glucometer (Optium exceed, manufactured by Abbott pharmaceuticals). It was necessary to use the finger tip blood for blood sugar estimation as close monitoring was necessary for diabetic patients when only 50 gm of starchy food was given after overnight fast and followed for next two hours. Venous blood was used for the estimation of insulin and HbA1c using ECLIA. The blood was collected in separate tubes for insulin and HbA1c (anticoagulant coated tube) estimation. Collection was made in the fasting state and at 30, 60, 90 and 120 min post consumption of foods (standard and test). The Incremental Area Under the Curve (IAUC) for each food sample was calculated using the standard trapezoid rule.
Food Composition Analysis
The food samples were analysed in triplicate for total, free reducing sugar and starch (Lane and Eynon method), Moisture (Vaccum oven method), Protein (Macro-kjeldhal method) and Fat (Soxhelet method) and Dietary Fiber (Enzymatic Digestion).
Statistical Analysis
Mean total glycaemic and insulinemic IAUC and the peak glycaemic values of test and standard food was compared using paired students’ t-test and was considered statistically significant at p<0.05 on two tailed testing. Standard deviation was calculated for the food composition values.
Results
GI based on equi-carbohydrate basis, was used to assess glycaemic quality of the food to determine the suitability of the selected food, especially in case of people with diabetes. In the present study the glycaemic and insulinemic impact of rice, a product with a high GI value (69±15-103) and chapatti, a low to medium GI value product (45.1±3.5-72±6), when assessed using GIFood method using equi-quantity of white bread as standard food, was found to be completely different from the observation made using equi-carbohydrate based GI method.
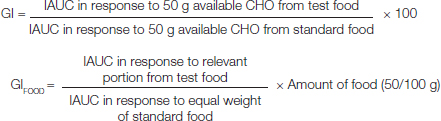
A consistent lower glycaemic response of rice as compared to whole wheat chapatti can be observed in both diabetic and normal individuals [Table/Fig-1a,b] when compared on the basis of equal quantity of the food. Postprandial peak glycaemic response as indicated by Cmax (mmol/L) in both the group was achieved by 30 min for rice and for chapatti it was found to be much slower by around 60 min. Cmax value of chapatti is higher than rice in normal group but in the diabetic group, the Cmax value was found to be highest with bread followed by chapatti and lowest for rice. The glycaemic response of rice in both the study groups was found to return to baseline by the end of the study period, indicating a faster absorption and utilization of rice as compared to whole wheat flour chapatti, which remains elevated after a slower absorption to achieve peak response at about 60 m in both normal and diabetic group.
Postprandial glycaemic response of standard and test foods in normal individuals (n=6) using GIFood method.
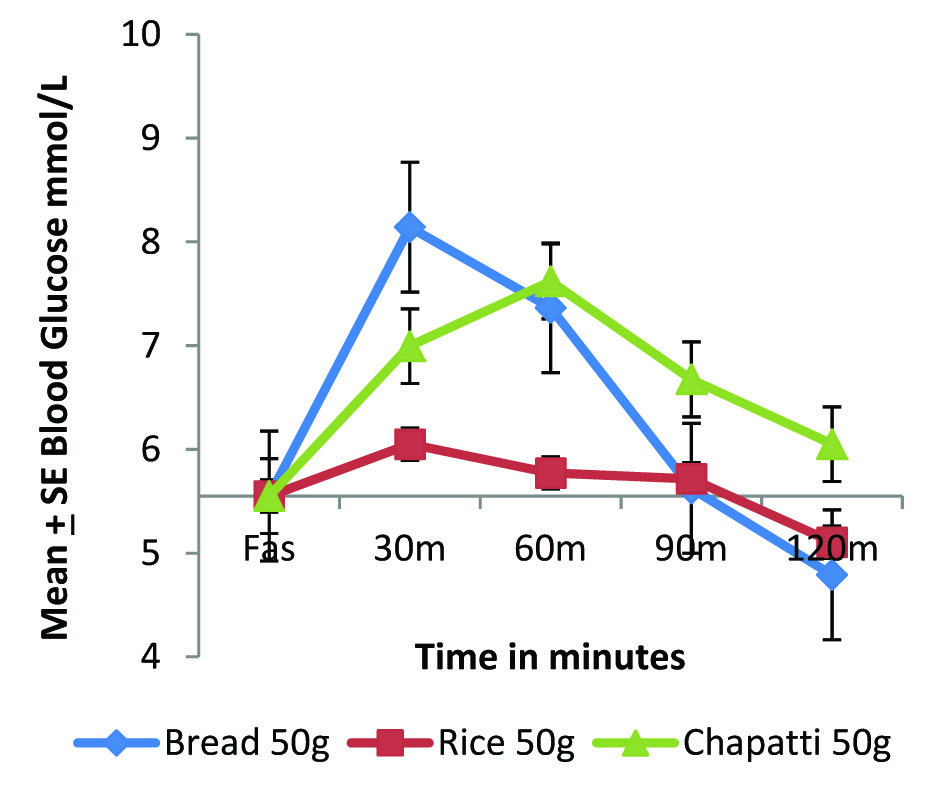
Postprandial glycaemic response of standard and test foods in diabetic individuals (n=8), using GIFood method.
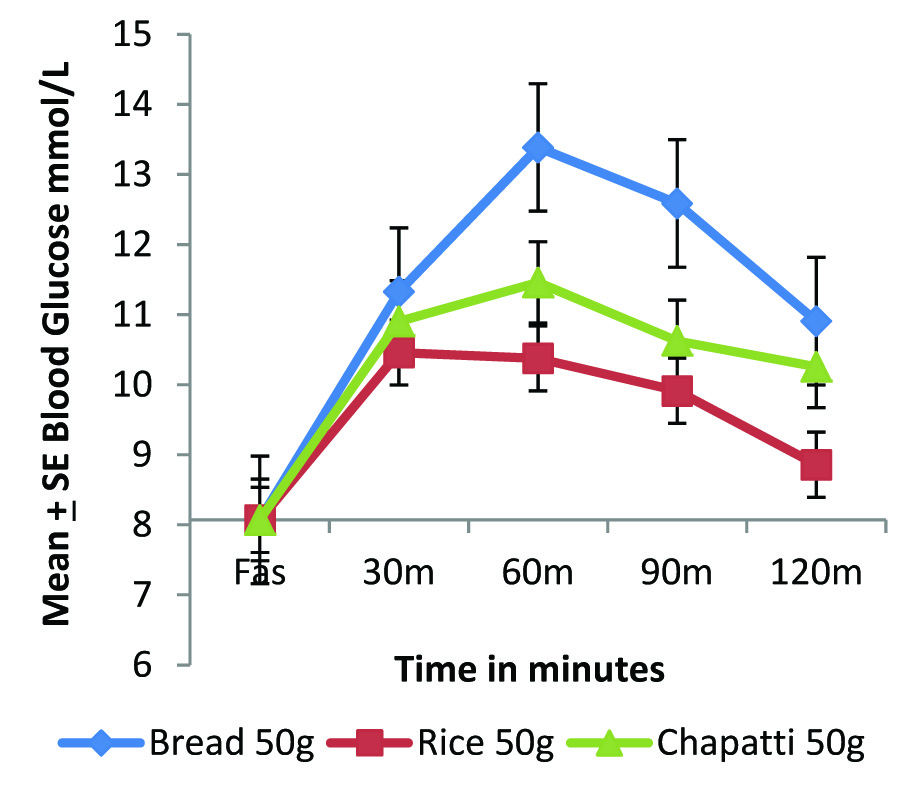
The glycaemic IAUC of bread was found to be significantly higher than rice in both normal (p<0.05) and diabetic group (p=0.01); [Table/Fig-2]. The glycaemic IAUC of chapatti is 42% higher than rice in the diabetic group, although statistically not significant [Table/Fig-2].
Glycaemic and Insulinemic IAUC of standard and test foods in normal and diabetic individuals.
The postprandial glycaemic impact of any food depends on the insulin status of the person. In type 2 diabetic person this insulin status is completely deranged, both in insulin resistant and insulin deficient type. Foods that demand a lower insulin secretion may be beneficial in such cases. The present study also evaluated the insulinemic response of standard and test foods.
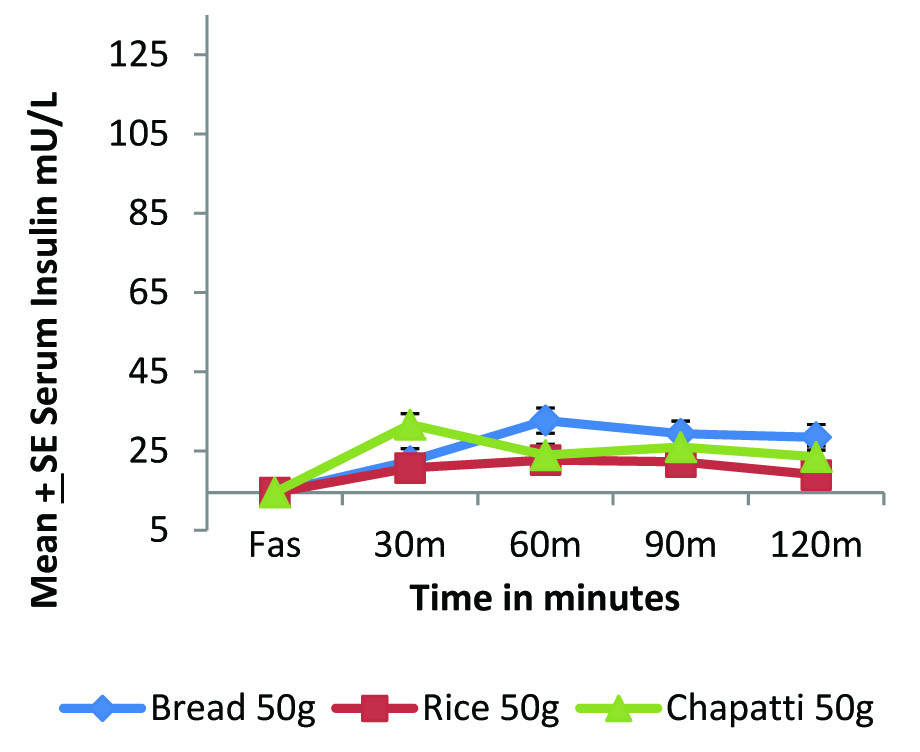
[Table/Fig-3a,b] highlights the compromised insulin status of diabetic individuals as compared to normal individuals. In normal individuals [Table/Fig-1,3] we can see that glucose and insulin curve follow exactly the same pattern. The overall insulinemic impact in terms of IAUC [Table/Fig-2] of both rice and whole wheat chapatti were significantly lower than bread (p<0.05).
Postprandial insulinemic response of standard and test foods in normal individuals (n=6).
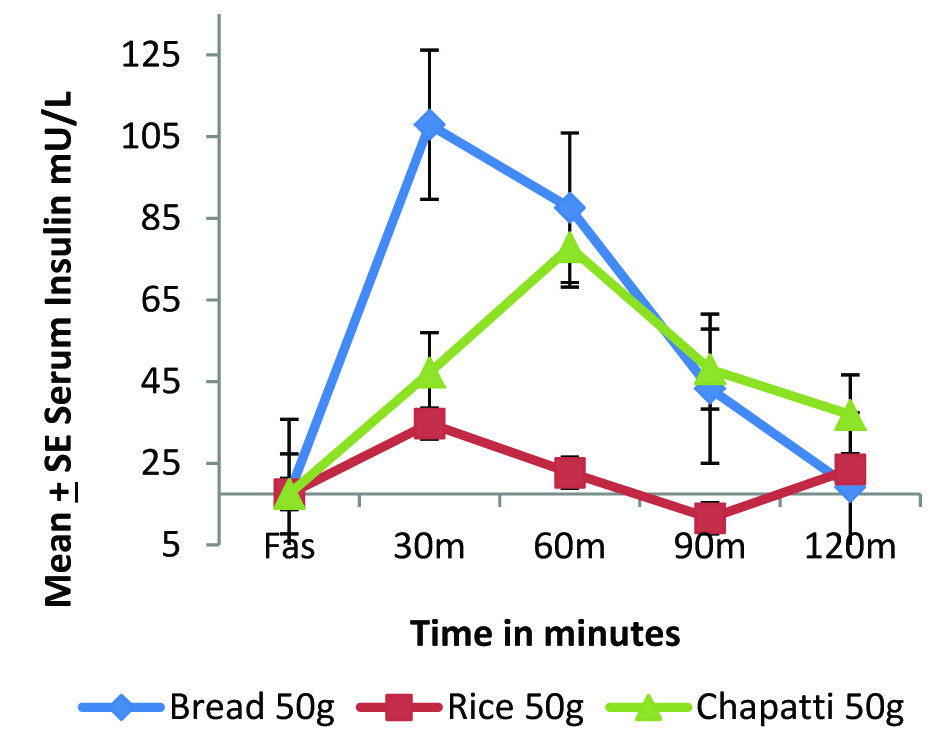
Postprandial insulinemic response of standard and test foods in diabetic individuals (n=8).
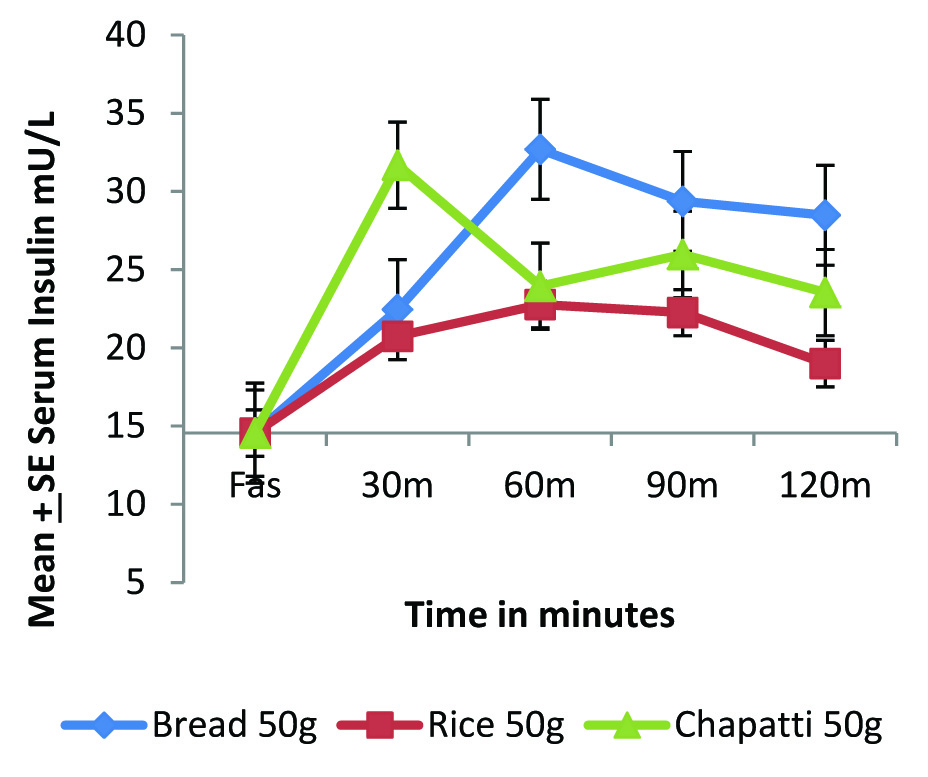
In diabetic condition the postprandial insulin secretion is very limited. Therefore, to see the micro level changing pattern, the graph has been expanded [Table/Fig-3c] and found that rice is exerting lowest insulinemic response followed by chapatti and lastly bread. The insulinemic IAUC of rice was significantly lower when compared with standard food bread (p<0.05) and the insulinemic IAUC of chapatti was observed to be 44% higher than rice but statistically insignificant.
Micro level changes in the postprandial insulinemic impact of standard and test foods in diabetic individuals (n=8).
Discussion
Two main common staple cereals for Indians are rice and wheat, which have been compared to see the better suitability for diabetic subjects who have compromised CHO metabolism due to change in their Insulin status. Postprandial impact of equal quantity of boiled white rice (SurtiKolum variety) and Indian flat bread made up of whole wheat flour were compared with white bread (Britannia Daily Fresh) as standard food on type 2 diabetic and paired control group.
The observed lower glycaemic and insulinemic impact exerted by rice could be attributed to several factors. The higher moisture content of boiled rice (75g %) as compared to bread and chapatti [Table/Fig-4] causes a relative decrease in the total solid content including starch and acts as an energy diluent, resulting in a decrease in the total glycaemic load of the meal [4,5]. On the other hand, the lower moisture content of starchy product bread and flat bread results in a higher total solid content with a higher carbohydrate load. The glycaemic response of rice in both diabetic and normal group was found to return to baseline by the end of the study period whereas for the flat bread, it remains elevated in the diabetic group. This indicates a faster absorption and utilization of rice as compared to wheat product.
Proximate composition of standard and experimental food.
| Food Product | Starchwwb g % | Protein(g %) | Fat(g %) | Moisture(g %) | D. Fiber (g %) |
|---|
| White Bread(Britannia) | 33.97±0.69 | 8.31±1.25 | 1.71±0.95 | 37.26±2.5 | 4.04 |
| Cooked Rice | 20.47±0.38 | 7.33±0.57 | 1.35±0.91 | 75.15±1.2 | 3.61 |
| Whole Wheat Chapatti | 39.34±3.5 | 10.35±1.01 | 2.5±0.96 | 27.16±5.3 | 5.88 |
wwb- wet weight basis.
The size of the starch granule present in the selected cereals may also impact the rate of digestion and absorption which in turn influences the glycaemic and insulin impact [9]. The larger and compact particles of wheat starch are digested slowly as a result of lower surface to volume ratio and intact cell wall which makes it difficult for the intestinal enzymes to digest the particle resulting in slower rise in the blood glucose levels [10]. Flat bread, due to the compact starch structure, lower moisture content and a resultant slower action of amylases causes a slow and prolonged release of sugars leading to a higher glycaemic response observed in normal individuals [5]. On the other hand, rice starch granule is considered to be the smallest (3-10 μm) among the cereals grains [11] and facilitate easy approach of amylase enzyme resulting faster absorption and utilization.
The proportion of amylopectin: amylose ratio of starch molecule is also an important determinant of postprandial glycaemic impact. As amylopectin is a branched and compact structure, it is more readily digested by the intestinal enzymes leading to a faster absorption and rise in blood sugar levels. In the present study, rice is seen to have a higher amylopectin: amylose ratio (4.4:1) as compared to chapatti (3:1) further explaining the slow and persistent rise of blood glucose levels post consumption of chapatti [5].
It is known that foods with an intact botanical structure exert a lower postprandial glycaemic impact. When rice is cooked, its solidity and structure is retained intact and possibly delay or render some fraction of the starch unavailable for absorption [12,13]. Mishra S et al., reported that with substituting partially intact nibbled kernels in place of flour during bread making, the rate of digestion and the resultant glycaemic impact is greatly reduced [14].
It has been reported that products made from finely milled wheat flour is digested in vitro at a significantly faster rate than its coarsely milled wheat flour equivalent and therefore induce a higher insulin response [10,15]. Additionally, with decrease in particle size, the amount of rapidly digestible starch increases and resistant starch content decreases [14]. Monro JA et al., reported that as the surface area of a sphere depends on the square of its radius, small increase in the particle size can have a large influence on the digestion rate [16]. Bread is associated with an open porous structure and such structures are reported to have high internal surface area which is readily available for amylase attack. This could explain the higher glycaemic and insulin response observed for bread in comparison with flat bread. Fardet A et al., in their study suggested development of breads with a more compact and structure and high density to reduce its glycaemic impact [17].
Limitation
Drop out of subjects due to five times blood collection in each sitting for two hours was a serious constrain for maintaining the sample size and was a limitation in the present study. It would have been better to have the experiment with larger number of sample size.
Conclusion
The study concludes that it is imperative to consider the glycaemic impact of foods as a whole and not on the basis of a single nutrient. We can see that between two main staple cereals, rice has lower glycaemic impact and lower insulin demand as compared to both wheat products as whole wheat Indian flat bread and white bread. It is known the elevated postprandial sugars is an important area of concern in diabetic individuals. It can thus be recommended that equal quantity of rice with its satiating capacity is a better option as compared to whole wheat product for diabetic person.
wwb- wet weight basis.
[1]. Jenkins DJA, Wolever TM, Taylor RH, Barker H, Fielden H, Baldwin JM, Glycaemic index of foods: a physiological basis for carbohydrate exchangeAm J Clin Nutr 1981 34(3):362-66. [Google Scholar]
[2]. Monro JA, Redefining the glycaemic index for dietary management of postprandial glycaemiaJ Nutr 2003 133:4256-58. [Google Scholar]
[3]. Paharia N, Senray K, Impact of selected processing of rice on postprandial glycaemic and insulinemic responses in individuals with type 2 diabetes mellitusAthens: ATINER’S Conference Paper Series 2015 :No:DIA2015-1503. [Google Scholar]
[4]. Senray K, Paharia N, Equi-quantity, equi-calorie and dose of rice on relative glycaemic and insulinemic response in diabetic patientsOpen J Endocr Metab Dis 2013 3:301-07. [Google Scholar]
[5]. Senray K, Singhania P, Glycaemic and Insulinemic responses to carbohydrate rich whole foodsJ Food Sci and Technol 2011 [Google Scholar]
[6]. Pi-Sunyer FX, Glycaemic index and diseaseAm J Clin Nutr 2002 76(suppl):290S-298S. [Google Scholar]
[7]. Laville M, Could glycaemic index be the basis of simple nutritional recommendations?Br J Nutr 2004 91:803-04. [Google Scholar]
[8]. Foster-Powell K, Holt SH, Brand-Miller JC, International table of glycaemic index and glycaemic loadAm J Clin Nutr 2002 76(2):5-56. [Google Scholar]
[9]. Hallfrisch J, Behall KM, Mechanisms of the effects of grains on insulin and glucose responsesJ Am Coll Nutr 2000 19(3):320S-325S. [Google Scholar]
[10]. Heaton KW, Marcus S, Emmett PM, Bolton CH, Particle size of wheat, maize, and oat test meals: effects on plasma glucose and insulin response and on the rate of starch digestion in vitroAm J Clin Nutr 1988 47:675-82. [Google Scholar]
[11]. Juliano BO, Rice starch: Production, properties and uses (2 ed.) Edited by Whistler R.L; BeMiller JN and Paschall EF 1984 San DiegoAcademic Press [Google Scholar]
[12]. Venn BJ, Mann JI, Cereal grains, legumes and diabetesEur J Clin Nutr 2004 58:1443-61. [Google Scholar]
[13]. Juntunen KS, Niskanen LK, Liukkonen KH, Poutanen KS, Holst JJ, Mykkänen HM, Postprandial glucose, insulin, and incretin responses to grain products in healthy subjectsAm J Clin Nutr 2002 75(2):254-62. [Google Scholar]
[14]. Mishra S, Hardacre A, Monro J, Food structure and carbohydrate digestibility 2012 [Google Scholar]
[15]. O’Donnell LJD, Emmett PM, Heaton KW, Size of flour particles and its relation to glycaemia, insulinemia and colonic diseaseBr Med J 1989 298:1616-17. [Google Scholar]
[16]. Monro JA, Mishra SS, Hardacre A, Glycaemic impact regulation based on progressive geometric changes in solid starch-based food particles during digestionFood Dig 2011 2(1-3):1-12. [Google Scholar]
[17]. Fardet A, Leenhardt F, Lioger D, Scalbert A, Remesy C, Parameters controlling the glycaemic response to breadsNutr Res Rev 2006 19(1):18-25. [Google Scholar]