Tissue hypoxia due to low cardiac output or CPB induced inflammatory response is an important predictor of multiorgan failure [1]. Systemic blood pressure and ratio of oxygen demand versus supply are commonly used techniques for monitoring tissue oxygenation [2]. Early Goal Directed Therapy (GDT) that includes targeted haemodynamic parameters, mix venous oxygen saturation and lactate level improves patient outcome in septic shock as well as in severe sepsis [3]. Multiorgan dysfunction resulting in death, has been reported in a number of patients inspite of maintaining systemic haemodynamic parameters and mixed venous saturation [4,5].
Shock such as cardiogenic, septic, hypovolemic or obstructive aetiology leads to decrease in tissue perfusion, which reflects as increase in P(v-a)CO2 on blood gas analysis [5-7].
Materials and Methods
This prospective observational study was carried out after approval by Institutional Ethics Committee and written and informed consents were obtained for all patients/parents who participated in the study. The time period was 1st August 2015 to 30th April 2016, and conducted at UN Mehta Institute of Cardiology and Research Centre, Ahmedabad, Gujarat, India. A total of 110 children, who underwent CPB during cardiac surgery, were included. Exclusion criteria were age more than 18 years, emergency surgery and refusal to participate in study.
Preoperative variables including demographics, diagnosis and previous medical history were collected. Intraoperative variables like CPB time, MAP, flow rate, cross clamp time, were recorded for all the patients. ABG and VBG were checked at four points: 1) Before CPB; 2) 10 minutes; 3) 30 minutes after initiation of CPB; and 4) off CPB.
Postoperative vitals, urine output, ABG, VBG, CBC, serum lactate, Chest X-ray (CXR) and Renal Function Test (RFT) were collected for 72 hours.
We measured oxygen tension, saturation, carbon dioxide tension, haemoglobin and lactate from both ABG and VBG analysis. By using following formula, we calculated arterial oxygen content (CaO2), venous oxygen content (CvO2), difference between venous and arterial oxygen content (C(a-v)O2), oxygen extraction ratio (O2ER), difference between arterial and venous carbon dioxide content P(v-a)CO2, and P(v-a)CO2/C(a-v)O2 ratio [22].
CaO2 = (1.34 x SaO2x Hb)+(0.003 x PaO2)
CvO2=(1.34 x SvO2x Hb)+(0.003 x PcvO2)
C(a−v)O2= CaO2−CcvO2
P(v-a)CO2 gap = PvCO2−PaCO2
P(v-a)CO2/C(a-v)O2ratio = P(v-a)CO2gap/C(a−v)O2
O2ER = C(a-v)O2/CaO2
Patients were followed during 72 hours of ICU stay, the ICU length of stay and ICU mortality were computed.
Statistical Analysis
Statistical analysis was carried out using SPSS version 20.0 software (SPSS Inc, USA). One-way ANOVA test and independent sample t-test were used to compare categorical and continuous variables respectively. Data were presented as mean±SD or proportion as appropriate. The p-value less than 0.05 was considered to be significant.
Results
The demographic and the preoperative CPB data have been presented in [Table/Fig-1,2 and 3]. Age ranged between the one month to 84 months.
Demographic profile of the study population.
| Variables | Height (cm) | Weight (kg) | Body surface area (kg/m2) | CPB time (min) | Cross clamp time (min) |
|---|
| Mean | 71.3303 | 6.7418 | 0.3837 | 95.3545 | 63.3107 |
| Median | 69.0000 | 6.2000 | 0.3531 | 87.0000 | 57.0000 |
| Standard deviation | 16.11076 | 3.05324 | 0.14125 | 43.17037 | 34.01961 |
| Range | 43-120 | 2.3-14 | 0.17-0.74 | 95.3-43.1 | 63.3-34.0 |
Describes data of pre CPB arterial and venous ph, PCO2, PO2, Hb, SpO2 and temperature.
| Preoperative CPB | Artery(Mean±SD) | Vein(Mean±SD) | p-value |
|---|
| pH | 7.343±0.09 | 7.336±0.09 | 0.5647 |
| PCO2 (mm Hg) | 43.65±10.30 | 45.11±9.90 | 0.2850 |
| SpO2 (%) | 89.58±15.56 | 70.82±16.51 | <0.001 |
| Hb (gm/dl) | 12.59±9.47 | 11.32±5.67 | 0.2288 |
| PO2 (mm Hg) | 180.65±160.9 | 45.86±17.01 | <0.001 |
* CPB: Cardiopulmonary bypass, PCO2:Partial pressure of carbon dioxide, SpO2: Saturation of oxygen, Hb: Haemoglobin, PO2: Partial pressure of oxygen.
Shows data and calculation after 10, 30 minutes after CPB and off CPB initiation.
| Variables | 10 minute after CPB(Mean±SD) | 30 minute after CPB(Mean±SD) | Off CPB(Mean±SD) | p-value |
|---|
| pH Artery | 7.38±0.07 | 7.43±0.07 | 7.35±0.09 | <0.001 |
| pH Vein | 7.33±0.07 | 7.39±0.07 | 7.31±0.08 | <0.001 |
| PCO2Artery (mmHg) | 42.87±8.61 | 37.01±6.42 | 40.59±9.05 | <0.001 |
| PCO2 Vein (mmHg) | 50.08±9.08 | 44.65±7.68 | 47.41±10.52 | <0.001 |
| P(v-a)CO2 (mmHg) | 7.20±3.48 | 7.36±3.92 | 6.68±5.55 | 0.490 |
| CaO2(ml O2/dl) | 12.77±1.54 | 13.16±3.37 | 15.44±2.86 | <0.001 |
| CvO2 (ml O2/dl) | 9.63±2.16 | 10.21±3.41 | 12±2.80 | <0.001 |
| C(a-v)O2 (ml O2/dl) | 3.14 ± 1.36 | 3.08±1.40 | 4.54±4.20 | <0.001 |
| P(v-a)CO2/C(a-v)CO2 | 2.73±1.55 | 2.90±1.68 | 2.00±3.23 | 0.009 |
| SpO2 Artery (%) | 107.31±85.72 | 99.10±3.87 | 94.29±9.93 | 0.149 |
| SpO2 Vein (%) | 78.29±12.74 | 79.55±15.05 | 74.19±12.58 | 0.009 |
| Lactate Artery (mg/dl) | 4.24±2.14 | 3.95±2.51 | 4.31±3.48 | 0.593 |
| Lactate Vein (mg/dl) | 4.12±1.86 | 3.76±2.27 | 4.28±3.03 | 0.270 |
| Sugar artery (gm %) | 195.98±85.10 | 234.06±79.06 | 249.46±88.58 | <0.001 |
| Sugar vein (gm %) | 191.5±83.22 | 224.06±81.04 | 238.40±81.92 | <0.001 |
| Hb Artery (gm %) | 9.02±1.08 | 9.80±1.20 | 12.67±9.74 | <0.001 |
| Hb Vein (gm %) | 9.00±1.06 | 10.30±3.59 | 11.84±1.98 | <0.001 |
| PO2 Artery (mmHg) | 270.42±109.6 | 261.64±70.7 | 176.49±132.17 | <0.001 |
| PO2 Vein (mmHg) | 50.33±27.43 | 48.05±16.33 | 52.96±58.76 | 0.641 |
| Do2 (ml O2/ min) | 290.90±35.02 | 301.62±76.19 | ---------------- | 0.181 |
* PCO2: Pressure of carbon dioxide, SpO2: Saturation of oxygen, PO2: Partial pressure of oxygen, DO2: Oxygen delivery, Hb: Haemoglobin, CaO2: Arterial oxygen concentration, CvO2: Ventricle oxygen concentration (a-v) O2: Difference of Arterial and venous oxygen content.
White Blood Cell (WBC) and Haemoglobin (Hb), creatinine and platelet count till third postoperative day are described in [Table/Fig-4]. There was significant fall in platelet count on second postoperative day, however, the count started recovering from day three.
Postoperative laboratory data.
| Preoperative(Mean±SD) | Postoperative Day 1(Mean±SD) | Postoperative Day 2(Mean±SD) | Postoperative Day 3(Mean±SD) | p-value |
|---|
| Total count (/Cumm) | 10802±3726.8 | 16240.4±6660.4 | 13386.3±5043.1 | 11968.4±5945.4 | <0.001 |
| Hb (gm %) | 13.07±2.78 | 14.29±9.02 | 11.98±1.87 | 13.23±13.75 | 0.326 |
| Creatinine (mg/dl) | 0.452±0.09 | 0.505±0.15 | 0.570±0.32 | 0.527±0.26 | 0.001 |
| Platelet (/Cumm) | 3409.6±1288.8 | 1818.4±839.08 | 1336.9±758.6 | 1468.8±1044.3 | <0.001 |
Discussion
Difference between mixed venous and arterial CO2content reflect the cardiac output, as per Fick equation. A linear relationship between venous to arterial CO2 content difference and cardiac output has been described [22].
According to the modified Fick equation applied to CO2, PCO2 gap is linearly related to CO2 production (VCO2) and inversely related to cardiac index. Considering the respiratory quotient (VCO2/VO2 ratio), VCO2 is directly related to O2 consumption (VO2) [20,23]. Under conditions of adapted cardiac output to VO2, even if the CO2 produced is higher than normal because of an additional anaerobic CO2 production, in the presence of sufficient flow to wash out the CO2 produced by the tissues, the P(v-a)CO2 should not be increased. Conversely, low blood flow can result in a widening of the P(v-a)CO2 even if no additional CO2 production occurs because of a CO2 stagnation phenomenon [19,24]. Venous hypercarbia is a marker of limited blood flow during cardiac arrest and shock states [5,9,25].
Mekontso-Dessap A et al., suggested that the P(v-a)CO2/(Ca-v)CO2 ratio might be a reflection of anaerobic metabolism, demonstrating a positive correlation between this parameter and lactate [9]. A study by Neviere R et al., thus demonstrated the key role of microvascular blood flow on gastric CO2 accumulation [23].
Meanwhile, Creteur J et al., found a significant correlation among sublingual CO2, gastric mucosal CO2 and microcirculatory heterogeneity in human septic shock during dobutamine infusion and suggested that the primary determinant of tissue CO2 accumulation was the microcirculatory blood flow [26]. Hence, there is an evident link between blood flow and tissue or local CO2 accumulation conducting to increase tissue or venous-to-arterial CO2 differences, but sometimes normal macro haemodynamics does not prevent elevation of P(v-a)CO2.
In a study by Mekontso-Dessap A et al., global anaerobic metab-olism reflected as increase in P(v-a)CO2 to oxygen consumption ratio [9].
During conditions of tissue hypoxia but with preserved blood flow (even though during anaerobic metabolism carbon dioxide production (VCO2) decreases less than oxygen consumption (VO2)), venous blood flow might be high enough to ensure adequate washout of the CO2 produced by hypoxic cells, thereby preventing a P(v-a)CO2 increase.
The increase in venous PCO2 would reflect a state of insufficient flow relative to CO2 production [26]. This condition has been demonstrated previously. Indeed, Vallet B et al., showed that the venous-to-arterial CO2 gap (PCO2 gap) increased during low blood flow-induced tissue hypoxia (ischemic hypoxia) while it remained unchanged during hypoxemia-induced hypoxia (hypoxic hypoxia) [18].
Our study, unlike others, was performed in paediatric cardiac surgical patients, who underwent CPB during cardiac surgery.
We hypothesize that P(v-a)CO2/C(a-v)O2, could be a better marker of anaerobic metabolism and low flow during CPB. Most of the studies performed, were in adult group of patients having sepsis. Our study has proved that P(v-a)CO2/C(a-v)O2 can detect anaerobic metabolism earlier than lactate.
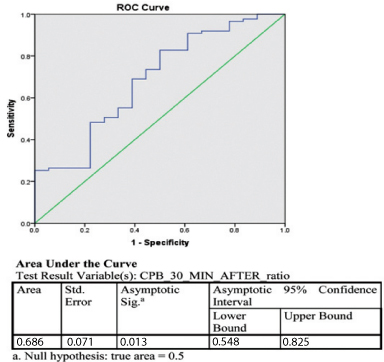
ROC curve at 30 minute of cardiopulmonary bypass time shows that P(v-a)CO2/C(a-v)O2 was more specific and sensitive than lactate to detect anaerobic metabolism. We suggest to use P(v-a)CO2/C(a-v)O2 as a marker to detect low flow on CPB [Table/Fig-5]. In our study, we found that platelet count decrease was significant on second postoperative day. However, recovery started from third postoperative day.
ROC curve of patients whose lactate level were high, compared with P(v-a)CO2/C(a-v)O2 ratio.
Limitation
Studies involving large population and multiple centers are required to support the study, as our present study is single centric and with a small size.
Conclusion
We suggest to use P(v-a)CO2/C(a-v)O2 ratio as a marker to detect anaerobic metabolism on CPB. Unfortunately, the calculation of CO2 content is very complex and subject to errors due to the number of variables included in the formula.
* CPB: Cardiopulmonary bypass, PCO2:Partial pressure of carbon dioxide, SpO2: Saturation of oxygen, Hb: Haemoglobin, PO2: Partial pressure of oxygen.
* PCO2: Pressure of carbon dioxide, SpO2: Saturation of oxygen, PO2: Partial pressure of oxygen, DO2: Oxygen delivery, Hb: Haemoglobin, CaO2: Arterial oxygen concentration, CvO2: Ventricle oxygen concentration (a-v) O2: Difference of Arterial and venous oxygen content.